Page 175 - Statistics II for Dummies
P. 175

Chapter 9: Testing Lots of Means? Come On Over to ANOVA!
                                  same graph. On the Same Scales for Graphs option, check the box for x and   159
                                  the box for y. This option gives you the same scale on both the x and y axes
                                  for all the histograms. Then click OK.


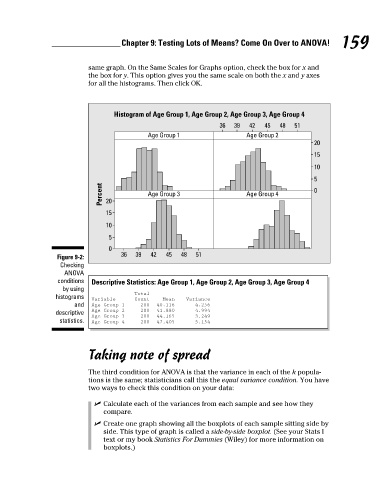
                                         Histogram of Age Group 1, Age Group 2, Age Group 3, Age Group 4
                                                                      36  39  42   45  48  51
                                                  Age Group 1                 Age Group 2
                                                                                                 20
                                                                                                 15

                                                                                                 10
                                                                                                 5
                                     Percent  20  Age Group 3                 Age Group 4        0


                                       15
                                       10
                                       5
                                       0
                         Figure 9-2:       36  39  42  45   48  51
                          Checking
                           ANOVA
                         conditions   Descriptive Statistics: Age Group 1, Age Group 2, Age Group 3, Age Group 4
                           by using
                                               Total
                         histograms   Variable  Count  Mean  Variance
                              and   Age Group 1   200  40.116   4.256
                         descriptive   Age Group 2   200  41.880   4.994
                                   Age Group 3   200  44.165   3.249
                          statistics.  Age Group 4   200  47.405   5.154


                                  Taking note of spread


                                  The third condition for ANOVA is that the variance in each of the k popula-
                                  tions is the same; statisticians call this the equal variance condition. You have
                                  two ways to check this condition on your data:

                                   ✓ Calculate each of the variances from each sample and see how they
                                      compare.
                                   ✓ Create one graph showing all the boxplots of each sample sitting side by
                                      side. This type of graph is called a side-by-side boxplot. (See your Stats I
                                      text or my book Statistics For Dummies (Wiley) for more information on
                                      boxplots.)


                                                                                                       7/23/09   9:31:28 PM
           15_466469-ch09.indd   159                                                                   7/23/09   9:31:28 PM
           15_466469-ch09.indd   159
   170   171   172   173   174   175   176   177   178   179   180