
Page 176 - Statistics II for Dummies
P. 176
160
Part III: Analyzing Variance with ANOVA
If one or more of the calculated variances is significantly different from the
others, the equal variance condition is not likely to be met. What does signifi-
cantly different mean? A hypothesis test for equal variances is the statistical
tool used to handle this question; however, it falls outside the scope of most
Stats II courses, so for now you can make a judgment call. I always say that if
the differences in the calculated variances are enough for you to write home
about (say they differ by 10 percent or more), the equal variance condition is
likely not to be met.
Similarly, if the lengths of one or more of the side-by-side boxplots looks dif-
ferent enough for you to write home about, the equal variance condition is
not likely to be met. (But listen, if you really do write home about any of your
statistical issues, you may want to spice up your life a bit.)
The length of the box portion of a boxplot is called the interquartile range. You
calculate it by taking the third quartile (the 75th percentile) minus the first
quartile (the 25th percentile.) See your Stats I text or Statistics For Dummies for
more info.
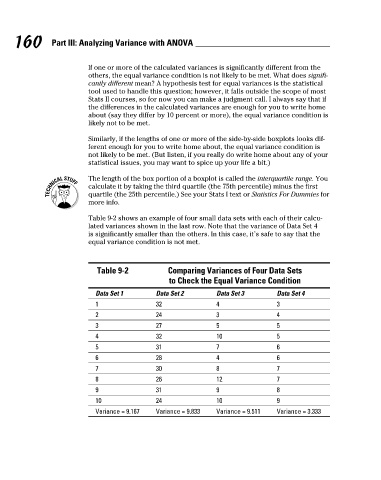
Table 9-2 shows an example of four small data sets with each of their calcu-
lated variances shown in the last row. Note that the variance of Data Set 4
is significantly smaller than the others. In this case, it’s safe to say that the
equal variance condition is not met.
Table 9-2 Comparing Variances of Four Data Sets
to Check the Equal Variance Condition
Data Set 1 Data Set 2 Data Set 3 Data Set 4
1 32 4 3
2 24 3 4
3 27 5 5
4 32 10 5
5 31 7 6
6 28 4 6
7 30 8 7
8 26 12 7
9 31 9 8
10 24 10 9
Variance = 9.167 Variance = 9.833 Variance = 9.511 Variance = 3.333
7/23/09 9:31:29 PM
15_466469-ch09.indd 160
15_466469-ch09.indd 160 7/23/09 9:31:29 PM