
Page 92 - Statistics and Data Analysis in Geology
P. 92
Statistics and Data Analysis in Geology - Chapter 4
Table 4-2. Measurements of magnesium concentration in stream water at 20
locations; distances are from stream mouth to sample locations.
Magnesium Magnesium
Distance (m) (ppm) Distance (m) (ppm)
0.0 6.44 11,098 2.86
1820 8.61 11,922 1.22
2542 5.24 12,530 1.09
2889 5.73 14,065 2.36
3460 3.81 14,937 2.24
4586 4.05 16,244 2.05
6020 2.95 17,632 2.23
684 1 2.57 19,002 0.42
7232 3.37 20,860 0.87
10,903 3.84 22,471 1.26
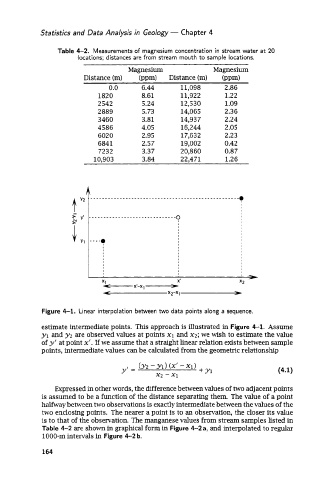
Figure 4-1. Linear interpolation between two data points along a sequence.
estimate intermediate points. This approach is illustrated in Figure 4-1. Assume
y1 and y2 are observed values at points XI and x2; we wish to estimate the value
of y' at point x'. If we assume that a straight linear relation exists between sample
points, intermediate values can be calculated from the geometric relationship
Expressed in other words, the difference betweenvalues of two adjacent points
is assumed to be a function of the distance separating them. The value of a point
halfway between two observations is exactly intermediate between the values of the
two enclosing points. The nearer a point is to an observation, the closer its value
is to that of the observation. The manganese values from stream samples listed in
Table 4-2 are shown in graphical form in Figure 4-2 a, and interpolated to regular
1000-m intervals in Figure 4-2 b.
164