
Page 97 - Statistics and Data Analysis in Geology
P. 97
Analysis of Sequences of Data
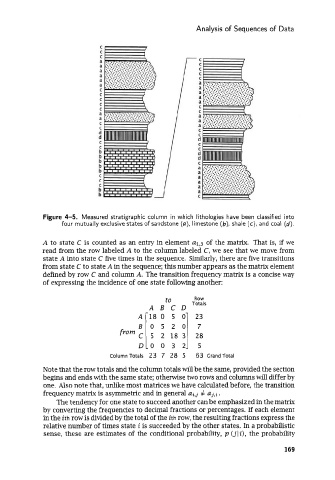
Figure 4-5. Measured stratigraphic column in which lithologies have been classified into
four mutually exclusive states of sandstone (a), limestone (b), shale (c), and coal (d).
A to state C is counted as an entry in element a1,3 of the matrix. That is, if we
read from the row labeled A to the column labeled C, we see that we move from
state A into state C five times in the sequence. Similarly, there are five transitions
from state C to state A in the sequence; this number appears as the matrix element
defined by row C and column A. The transition frequency matrix is a concise way
of expressing the incidence of one state following another:
to Row
ABCD Totals
B
A r18 0 5 01 23
from C 0 5 z o i2 18 3 28
5
DL0 0 3 21 5
Column Totals 23 7 28 5 63 Grand Total
Note that the row totals and the column totals will be the same, provided the section
begins and ends with the same state; otherwise two rows and columns will differ by
one. Also note that, unlike most matrices we have calculated before, the transition
frequency matrix is asymmetric and in general ai,j # aj,i.
The tendency for one state to succeed another can be emphasized in the matrix
by converting the frequencies to decimal fractions or percentages. If each element
in the ith row is divided by the total of the ith row, the resulting fractions express the
relative number of times state i is succeeded by the other states. In a probabilistic
sense, these are estimates of the conditional probability, p (jli), the probability
169