
Page 96 - Statistics and Data Analysis in Geology
P. 96
Statistics and Data Analysis in Geology - Chapter 4
the study of stratigraphic sequences and diamond-drill cores through ore deposits.
Some work also has been done on mineral successions along traverses across thin
sections. These applications will be considered in greater detail later in this chapter.
Markov Chains
In many geologic investigations, data sequences may be created that consist of
ordered successions of mutually exclusive states. An example is a point-count tra-
verse across a thin section, where the states are the minerals noted at succeeding
points. Measured stratigraphic sections also have the form of series of lithologies,
as may drill holes through zoned ore bodies where the rocks encountered are clas-
sified into different types of ore and gangue. Observations along a traverse may
be taken at equally spaced intervals, as in point counting, or they may be taken
wherever a change in state occurs, as is commonly done in the measurement of
stratigraphic sections. In the first instance, we would expect runs of the same state;
that is, several successive observations could conceivably fall in the same category.
This obviously cannot happen if observations are taken only where states change.
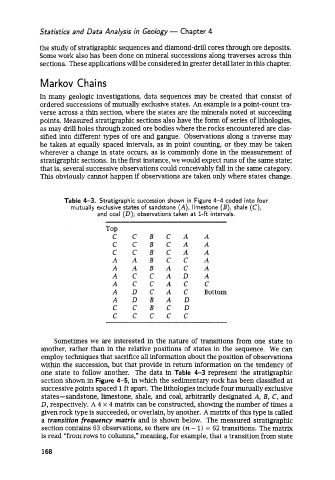
Table 4-3. Stratigraphic succession shown in Figure 4-4 coded into four
mutually exclusive states of sandstone (A), limestone (B), shale (C),
and coal (D); observations taken at 1-ft intervals.
TOP
C C B C A A
C C B C A A
C C B C A A
A A B C C A
A A B A C A
A C C A D A
A C C A C C
A D C A C Bottom
A D B A D
C C B C D
c c c c c
Sometimes we are interested in the nature of transitions from one state to
another, rather than in the relative positions of states in the sequence. We can
employ techniques that sacrifice all information about the position of observations
within the succession, but that provide in return information on the tendency of
one state to follow another. The data in Table 4-3 represent the stratigraphic
section shown in Figure 4-5, in which the sedimentary rock has been classified at
successive points spaced 1 ft apart. The lithologies include four mutually exclusive
states-sandstone, limestone, shale, and coal, arbitrarily designated A, B, C, and
D, respectively. A 4 x 4 matrix can be constructed, showing the number of times a
given rock type is succeeded, or overlain, by another. A matrix of this type is called
a transition frequency matrix and is shown below. The measured stratigraphic
section contains 63 observations, so there are (n - 1) = 62 transitions. The matrix
is read “from rows to columns,” meaning, for example, that a transition from state
168