
Page 95 - Statistics and Data Analysis in Geology
P. 95
25 301 Analysis of Sequences of Data
0
0
0
0
0 0 0
0
0.
0 0 0
a
25 301 0 0
10 I I I I I I I I I I I I I 1 1 ' ' 1 ' ' 1 ' " ' 1 ' " ' 1 ' " ' " " ' I ' ' " " ' " I" " ' " " I
200
0
100
300
600
500
400
Y 2ol 0 0 0 0
0 0 0 0 0
15- 0
b
10 (I r I 4 4 I I1 II 1 8 8 II 1 8 1 I IIII 1 0 0 4 1 1 I t 1 If II r 1 1 8 II II 4 I 0 1 ) I I 8 I O U I! 1
r
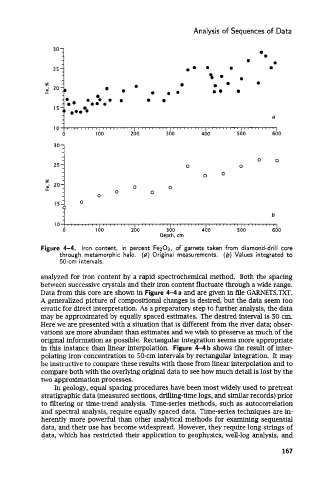
analyzed for iron content by a rapid spectrochemical method. Both the spacing
between successive crystals and their iron content fluctuate through a wide range.
Data from this core are shown in Figure 4-4a and are given in file GARNETS.TXT.
A generalized picture of compositional changes is desired, but the data seem too
erratic for direct interpretation. As a preparatory step to further analysis, the data
may be approximated by equally spaced estimates. The desired interval is 50 cm.
Here we are presented with a situation that is different from the river data; obser-
vations are more abundant than estimates and we wish to preserve as much of the
original information as possible. Rectangular integration seems more appropriate
in this instance than linear interpolation. Figure 4-4 b shows .the result of inter-
polating iron concentration to 50-cm intervals by rectangular integration. It may
be instructive to compare these results with those from linear interpolation and to
compare both with the overlying original data to see how much detail is lost by the
two approximation processes.
In geology, equal spacing procedures have been most widely used to pretreat
stratigraphic data (measured sections, drilling-time logs, and similar records) prior
to filtering or time-trend analysis. Time-series methods, such as autocorrelation
and spectral analysis, require equally spaced data. Time-series techniques are in-
herently more powerful than other analytical methods for examining sequential
data, and their use has become widespread. However, they require long strings of
data, which has restricted their application to geophysics, well-log analysis, and
167