
Page 241 - Statistics for Environmental Engineers
P. 241
L1592_frame_C27.fm Page 244 Tuesday, December 18, 2001 2:47 PM
2
The experimental design just described does not produce an estimate of σ because there is no replication
at any experimental condition. In this case the significance of effects and interactions is determined from
a normal plot of the effects (Box et al., 1978). This plot is illustrated later.
Case Study Solution
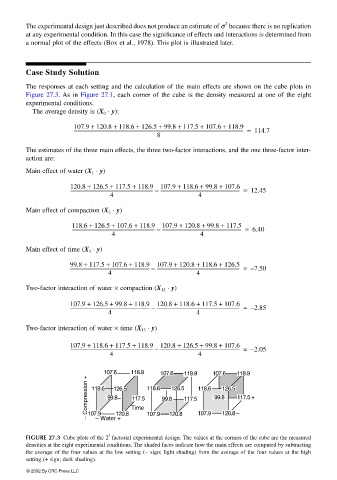
The responses at each setting and the calculation of the main effects are shown on the cube plots in
Figure 27.3. As in Figure 27.1, each corner of the cube is the density measured at one of the eight
experimental conditions.
The average density is (X 0 ⋅ y):
107.9 + 120.8 + 118.6 + 126.5 + 99.8 + 117.5 + 107.6 + 118.9
----------------------------------------------------------------------------------------------------------------------------------------------------- = 114.7
8
The estimates of the three main effects, the three two-factor interactions, and the one three-factor inter-
action are:
Main effect of water (X 1 ⋅ y)
120.8 + 126.5 + 117.5 + 118.9 107.9 + 118.6 + 99.8 + 107.6
------------------------------------------------------------------------- – --------------------------------------------------------------------- = 12.45
4 4
Main effect of compaction (X 2 ⋅ y)
118.6 + 126.5 + 107.6 + 118.9 107.9 + 120.8 + 99.8 + 117.5
------------------------------------------------------------------------- – --------------------------------------------------------------------- = 6.40
4 4
Main effect of time (X 3 ⋅ y)
99.8 + 117.5 + 107.6 + 118.9 107.9 + 120.8 + 118.6 + 126.5
--------------------------------------------------------------------- – ------------------------------------------------------------------------- = – 7.50
4 4
Two-factor interaction of water × compaction (X 12 ⋅ y)
107.9 + 126.5 + 99.8 + 118.9 120.8 + 118.6 + 117.5 + 107.6
--------------------------------------------------------------------- – ------------------------------------------------------------------------- = – 2.85
4 4
Two-factor interaction of water × time (X 13 ⋅ y)
107.9 + 118.6 + 117.5 + 118.9 120.8 + 126.5 + 99.8 + 107.6
------------------------------------------------------------------------- – --------------------------------------------------------------------- = – 2.05
4 4
107.6 118.9 107.6 118.9 107.6 118.9
– Compression + 107.9 99.8 120.8 Time 118.6 99.8 120.8 117.5 118.6 99.8 126.5 117.5 +
126.5
126.5
118.6
117.5
107.9
120.8 –
107.9
– Water +
3
FIGURE 27.3 Cube plots of the 2 factorial experimental design. The values at the corners of the cube are the measured
densities at the eight experimental conditions. The shaded faces indicate how the main effects are computed by subtracting
the average of the four values at the low setting (− sign; light shading) from the average of the four values at the high
setting (+ sign; dark shading).
© 2002 By CRC Press LLC