
Page 237 - Statistics for Environmental Engineers
P. 237
L1592_frame_C27.fm Page 240 Tuesday, December 18, 2001 2:47 PM
TABLE 27.1
Experimental Conditions and Responses for Eight Fly
Ash Specimens
Factor Density
3
Run W (%) C (psi) T (min) (lb/ft )
1 4 60 5 107.9
2 10 60 5 120.8
3 4 260 5 118.6
4 10 260 5 126.5
5 4 60 20 99.8
6 10 60 20 117.5
7 4 260 20 107.6
8 10 260 20 118.9
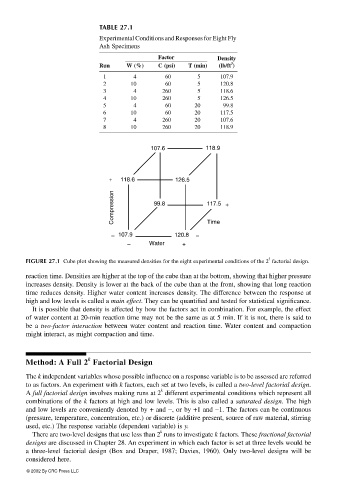
107.6 118.9
+ 118.6 126.5
Compression 99.8 117.5 +
– 107.9 120.8 – Time
– Water +
3
FIGURE 27.1 Cube plot showing the measured densities for the eight experimental conditions of the 2 factorial design.
reaction time. Densities are higher at the top of the cube than at the bottom, showing that higher pressure
increases density. Density is lower at the back of the cube than at the front, showing that long reaction
time reduces density. Higher water content increases density. The difference between the response at
high and low levels is called a main effect. They can be quantified and tested for statistical significance.
It is possible that density is affected by how the factors act in combination. For example, the effect
of water content at 20-min reaction time may not be the same as at 5 min. If it is not, there is said to
be a two-factor interaction between water content and reaction time. Water content and compaction
might interact, as might compaction and time.
k
Method: A Full 2 Factorial Design
The k independent variables whose possible influence on a response variable is to be assessed are referred
to as factors. An experiment with k factors, each set at two levels, is called a two-level factorial design.
k
A full factorial design involves making runs at 2 different experimental conditions which represent all
combinations of the k factors at high and low levels. This is also called a saturated design. The high
and low levels are conveniently denoted by + and −, or by +1 and −1. The factors can be continuous
(pressure, temperature, concentration, etc.) or discrete (additive present, source of raw material, stirring
used, etc.) The response variable (dependent variable) is y.
k
There are two-level designs that use less than 2 runs to investigate k factors. These fractional factorial
designs are discussed in Chapter 28. An experiment in which each factor is set at three levels would be
a three-level factorial design (Box and Draper, 1987; Davies, 1960). Only two-level designs will be
considered here.
© 2002 By CRC Press LLC