
Page 234 - Statistics for Environmental Engineers
P. 234
L1592_frame_C26.fm Page 236 Tuesday, December 18, 2001 2:46 PM
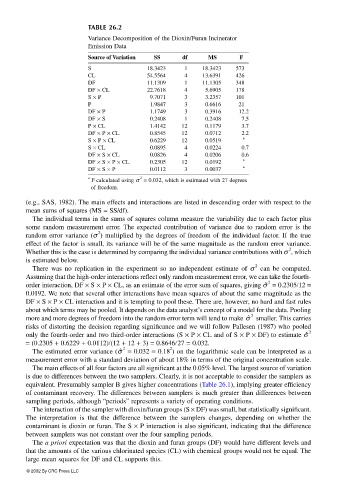
TABLE 26.2
Variance Decomposition of the Dioxin/Furan Incinerator
Emission Data
Source of Variation SS df MS F
S 18.3423 1 18.3423 573
CL 54.5564 4 13.6391 426
DF 11.1309 1 11.1305 348
DF × CL 22.7618 4 5.6905 178
S × P 9.7071 3 3.2357 101
P 1.9847 3 0.6616 21
DF × P 1.1749 3 0.3916 12.2
DF × S 0.2408 1 0.2408 7.5
P × CL 1.4142 12 0.1179 3.7
DF × P × CL 0.8545 12 0.0712 2.2
a
S × P × CL 0.6229 12 0.0519
S × CL 0.0895 4 0.0224 0.7
DF × S × CL 0.0826 4 0.0206 0.6
a
DF × S × P × CL 0.2305 12 0.0192
a
DF × S × P 0.0112 3 0.0037
a 2
F calculated using σ = 0.032, which is estimated with 27 degrees
of freedom.
(e.g., SAS, 1982). The main effects and interactions are listed in descending order with respect to the
mean sums of squares (MS = SS/df).
The individual terms in the sums of squares column measure the variability due to each factor plus
some random measurement error. The expected contribution of variance due to random error is the
2
random error variance (σ ) multiplied by the degrees of freedom of the individual factor. If the true
effect of the factor is small, its variance will be of the same magnitude as the random error variance.
2
Whether this is the case is determined by comparing the individual variance contributions with σ , which
is estimated below.
2
There was no replication in the experiment so no independent estimate of σ can be computed.
Assuming that the high-order interactions reflect only random measurement error, we can take the fourth-
order interaction, DF × S × P × CL, as an estimate of the error sum of squares, giving σ ˆ 2 = 0.2305/12 =
0.0192. We note that several other interactions have mean squares of about the same magnitude as the
DF × S × P × CL interaction and it is tempting to pool these. There are, however, no hard and fast rules
about which terms may be pooled. It depends on the data analyst’s concept of a model for the data. Pooling
more and more degrees of freedom into the random error term will tend to make σ ˆ 2 smaller. This carries
risks of distorting the decision regarding significance and we will follow Pallesen (1987) who pooled
only the fourth-order and two third-order interactions (S × P × CL and of S × P × DF) to estimate σ ˆ 2
= (0.2305 + 0.6229 + 0.0112)/(12 + 12 + 3) = 0.8646/27 = 0.032.
2
The estimated error variance (σ ˆ 2 = 0.032 = 0.18 ) on the logarithmic scale can be interpreted as a
measurement error with a standard deviation of about 18% in terms of the original concentration scale.
The main effects of all four factors are all significant at the 0.05% level. The largest source of variation
is due to differences between the two samplers. Clearly, it is not acceptable to consider the samplers as
equivalent. Presumably sampler B gives higher concentrations (Table 26.1), implying greater efficiency
of contaminant recovery. The differences between samplers is much greater than differences between
sampling periods, although “periods” represents a variety of operating conditions.
The interaction of the sampler with dioxin/furan groups (S × DF) was small, but statistically significant.
The interpretation is that the difference between the samplers changes, depending on whether the
contaminant is dioxin or furan. The S × P interaction is also significant, indicating that the difference
between samplers was not constant over the four sampling periods.
The a priori expectation was that the dioxin and furan groups (DF) would have different levels and
that the amounts of the various chlorinated species (CL) with chemical groups would not be equal. The
large mean squares for DF and CL supports this.
© 2002 By CRC Press LLC