
Page 232 - Statistics for Environmental Engineers
P. 232
L1592_frame_C26.fm Page 234 Tuesday, December 18, 2001 2:46 PM
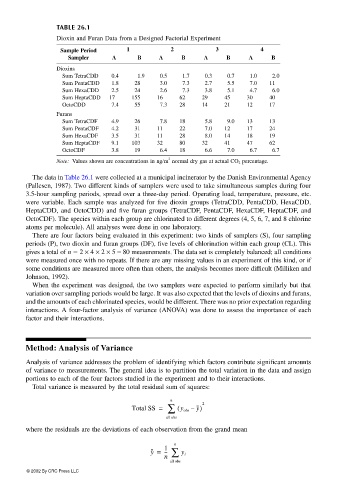
TABLE 26.1
Dioxin and Furan Data from a Designed Factorial Experiment
Sample Period 1 2 3 4
Sampler A B A B A B A B
Dioxins
Sum TetraCDD 0.4 1.9 0.5 1.7 0.3 0.7 1.0 2.0
Sum PentaCDD 1.8 28 3.0 7.3 2.7 5.5 7.0 11
Sum HexaCDD 2.5 24 2.6 7.3 3.8 5.1 4.7 6.0
Sum HeptaCDD 17 155 16 62 29 45 30 40
OctoCDD 7.4 55 7.3 28 14 21 12 17
Furans
Sum TetraCDF 4.9 26 7.8 18 5.8 9.0 13 13
Sum PentaCDF 4.2 31 11 22 7.0 12 17 24
Sum HexaCDF 3.5 31 11 28 8.0 14 18 19
Sum HeptaCDF 9.1 103 32 80 32 41 47 62
OctoCDF 3.8 19 6.4 18 6.6 7.0 6.7 6.7
3
Note: Values shown are concentrations in ng/m normal dry gas at actual CO 2 percentage.
The data in Table 26.1 were collected at a municipal incinerator by the Danish Environmental Agency
(Pallesen, 1987). Two different kinds of samplers were used to take simultaneous samples during four
3.5-hour sampling periods, spread over a three-day period. Operating load, temperature, pressure, etc.
were variable. Each sample was analyzed for five dioxin groups (TetraCDD, PentaCDD, HexaCDD,
HeptaCDD, and OctoCDD) and five furan groups (TetraCDF, PentaCDF, HexaCDF, HeptaCDF, and
OctoCDF). The species within each group are chlorinated to different degrees (4, 5, 6, 7, and 8 chlorine
atoms per molecule). All analyses were done in one laboratory.
There are four factors being evaluated in this experiment: two kinds of samplers (S), four sampling
periods (P), two dioxin and furan groups (DF), five levels of chlorination within each group (CL). This
gives a total of n = 2 × 4 × 2 × 5 = 80 measurements. The data set is completely balanced; all conditions
were measured once with no repeats. If there are any missing values in an experiment of this kind, or if
some conditions are measured more often than others, the analysis becomes more difficult (Milliken and
Johnson, 1992).
When the experiment was designed, the two samplers were expected to perform similarly but that
variation over sampling periods would be large. It was also expected that the levels of dioxins and furans,
and the amounts of each chlorinated species, would be different. There was no prior expectation regarding
interactions. A four-factor analysis of variance (ANOVA) was done to assess the importance of each
factor and their interactions.
Method: Analysis of Variance
Analysis of variance addresses the problem of identifying which factors contribute significant amounts
of variance to measurements. The general idea is to partition the total variation in the data and assign
portions to each of the four factors studied in the experiment and to their interactions.
Total variance is measured by the total residual sum of squares:
n
Total SS = ∑ ( y obs – y) 2
all obs
where the residuals are the deviations of each observation from the grand mean
n
y = 1 ∑ y i
---
n
all obs
© 2002 By CRC Press LLC