
Page 228 - Statistics for Environmental Engineers
P. 228
L1592_frame_C25.fm Page 230 Tuesday, December 18, 2001 2:45 PM
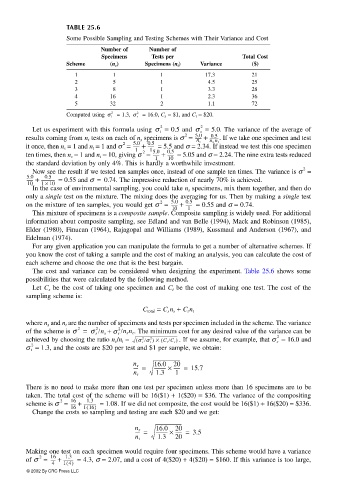
TABLE 25.6
Some Possible Sampling and Testing Schemes with Their Variance and Cost
Number of Number of
Specimens Tests per Total Cost
Scheme (n s ) Specimens (n t ) Variance ($)
1 1 1 17.3 21
2 5 1 4.5 25
3 8 1 3.3 28
4 16 1 2.3 36
5 32 2 1.1 72
2 2
Computed using σ t = 1.3, σ s = 16.0, C s = $1, and C t = $20.
2 2
Let us experiment with this formula using σ t = 0.5 and σ s = 5.0. The variance of the average of
2
results coming from n t tests on each of n s specimens is σ = ------- + ----------. If we take one specimen and test
5.0
0.5
2
n s n t
n s
it once, then n s = 1 and n t = 1 and σ = ------- + 0.5 = 5.5 and σ = 2.34. If instead we test this one specimen
5.0
-------
1
1
5.0
ten times, then n s = 1 and n t = 10, giving σ = ------- + 0.5 = 5.05 and σ = 2.24. The nine extra tests reduced
2
-------
1 10
the standard deviation by only 4%. This is hardly a worthwhile investment.
2
Now see the result if we tested ten samples once, instead of one sample ten times. The variance is σ =
0.5
5.0
------- + --------------- = 0.55 and σ = 0.74. The impressive reduction of nearly 70% is achieved.
10 1 × 10
In the case of environmental sampling, you could take n s specimens, mix them together, and then do
only a single test on the mixture. The mixing does the averaging for us. Then by making a single test
on the mixture of ten samples, you would get σ = ------- + 0.5 = 0.55 and σ = 0.74.
5.0
2
-------
10 1
This mixture of specimens is a composite sample. Composite sampling is widely used. For additional
information about composite sampling, see Edland and van Belle (1994), Mack and Robinson (1985),
Elder (1980), Finucan (1964), Rajagopal and Williams (1989), Kussmaul and Anderson (1967), and
Edelman (1974).
For any given application you can manipulate the formula to get a number of alternative schemes. If
you know the cost of taking a sample and the cost of making an analysis, you can calculate the cost of
each scheme and choose the one that is the best bargain.
The cost and variance can be considered when designing the experiment. Table 25.6 shows some
possibilities that were calculated by the following method.
Let C s be the cost of taking one specimen and C t be the cost of making one test. The cost of the
sampling scheme is:
C total = C s n s + C t n t
where n s and n t are the number of specimens and tests per specimen included in the scheme. The variance
of the scheme is σ = σ s /n s + σ t 2 /n s n t . The minimum cost for any desired value of the variance can be
2
2
achieved by choosing the ratio n s /n t = (σ s /σ t ) × (C t /C s ) . If we assume, for example, that σ s 2 = 16.0 and
2
2
2
σ t = 1.3, and the costs are $20 per test and $1 per sample, we obtain:
------ =
---------- ×
---- = 16.0 20 15.7
n s
n t 1.3 1
There is no need to make more than one test per specimen unless more than 16 specimens are to be
taken. The total cost of the scheme will be 16($1) + 1($20) = $36. The variance of the compositing
16
1.3
scheme is σ = ------ + -------------- = 1.08. If we did not composite, the cost would be 16($1) + 16($20) = $336.
2
16 1(16)
Change the costs so sampling and testing are each $20 and we get:
------ =
---- = 16.0 20 3.5
---------- ×
n s
1.3 20
n t
Making one test on each specimen would require four specimens. This scheme would have a variance
2
of σ = ------ + ----------- = 4.3, σ = 2.07, and a cost of 4($20) + 4($20) = $160. If this variance is too large,
1.3
16
4 1(4)
© 2002 By CRC Press LLC