
Page 230 - Statistics for Environmental Engineers
P. 230
L1592_frame_C25.fm Page 232 Tuesday, December 18, 2001 2:45 PM
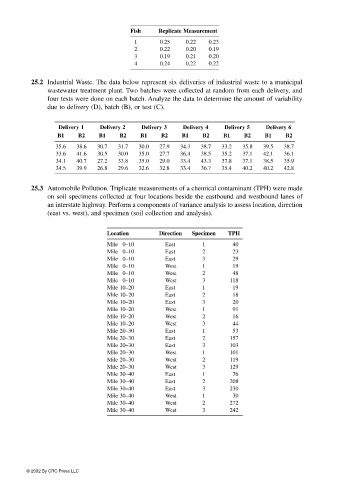
Fish Replicate Measurement
1 0.25 0.22 0.23
2 0.22 0.20 0.19
3 0.19 0.21 0.20
4 0.24 0.22 0.22
25.2 Industrial Waste. The data below represent six deliveries of industrial waste to a municipal
wastewater treatment plant. Two batches were collected at random from each delivery, and
four tests were done on each batch. Analyze the data to determine the amount of variability
due to delivery (D), batch (B), or test (C).
Delivery 1 Delivery 2 Delivery 3 Delivery 4 Delivery 5 Delivery 6
B1 B2 B1 B2 B1 B2 B1 B2 B1 B2 B1 B2
35.6 38.6 30.7 31.7 30.0 27.9 34.3 38.7 33.2 35.8 39.5 38.7
33.6 41.6 30.5 30.0 35.0 27.7 36.4 38.5 35.2 37.1 42.1 36.1
34.1 40.7 27.2 33.8 35.0 29.0 33.4 43.3 37.8 37.1 38.5 35.9
34.5 39.9 26.8 29.6 32.6 32.8 33.4 36.7 35.4 40.2 40.2 42.8
25.3 Automobile Pollution. Triplicate measurements of a chemical contaminant (TPH) were made
on soil specimens collected at four locations beside the eastbound and westbound lanes of
an interstate highway. Perform a components of variance analysis to assess location, direction
(east vs. west), and specimen (soil collection and analysis).
Location Direction Specimen TPH
Mile 0–10 East 1 40
Mile 0–10 East 2 23
Mile 0–10 East 3 29
Mile 0–10 West 1 19
Mile 0–10 West 2 48
Mile 0–10 West 3 118
Mile 10–20 East 1 19
Mile 10–20 East 2 18
Mile 10–20 East 3 20
Mile 10–20 West 1 91
Mile 10–20 West 2 16
Mile 10–20 West 3 44
Mile 20–30 East 1 53
Mile 20–30 East 2 157
Mile 20–30 East 3 103
Mile 20–30 West 1 101
Mile 20–30 West 2 119
Mile 20–30 West 3 129
Mile 30–40 East 1 76
Mile 30–40 East 2 208
Mile 30–40 East 3 230
Mile 30–40 West 1 30
Mile 30–40 West 2 272
Mile 30–40 West 3 242
© 2002 By CRC Press LLC