
Page 235 - Statistics for Environmental Engineers
P. 235
L1592_frame_C26.fm Page 237 Tuesday, December 18, 2001 2:46 PM
Comments
When the experiment was planned, variation between sampling periods was expected to be large and
differences between samplers were expected to be small. The data showed both expectations to be wrong.
The major source of variation was between the two samplers. Variation between periods was small,
although statistically significant.
Several interactions were statistically significant. These, however, have no particular practical importance
until the matter of which sampler to use is settled. Presumably, after further research, one of the samplers
will be accepted and the other rejected, or one will be modified. If one of the samplers were modified to
make it perform more like the other, this analysis of variance would not represent the performance of the
modified equipment.
Analysis of variance is a useful tool for breaking down the total variability of designed experiments into
interpretable components. For well-designed (complete and fully balanced) experiments, this partitioning
is unique and allows clear conclusions to be drawn from the data. If the design contains missing data, the
partition of the variation is not unique and the interpretation depends on the number of missing values,
their location in the table, and the relative magnitude of the variance components (Cohen and Cohen, 1983).
References
Box, G. E. P., W. G. Hunter, and J. S. Hunter (1978). Statistics for Experimenters: An Introduction to Design,
Data Analysis, and Model Building, New York, Wiley Interscience.
Cohen, J. and P. Cohen (1983). Applied Multiple Regression & Correlation Analysis for the Behavioral Sciences,
2nd ed., New York, Lawrence Erlbann Assoc.
Milliken, G. A. and D. E. Johnson (1992). Analysis of Messy Data, Vol. I: Designed Experiments, New York,
Van Nostrand Reinhold.
Milliken, G. A. and D. E. Johnson (1989). Analysis of Messy Data, Vol. II: Nonreplicated Experiments, New
York, Van Nostrand Reinhold.
Pallesen, L. (1987). “Statistical Assessment of PCDD and PCDF Emission Data,” Waste Manage. Res., 5,
367–379.
Rao, C. R. (1965). Linear Statistical Inference and Its Applications, New York, John Wiley.
SAS Institute Inc. (1982). SAS User’s Guide: Statistics, Cary, NC.
Scheffe, H. (1959). The Analysis of Variance, New York, John Wiley.
Exercises
26.1 Dioxin and Furan Sampling. Reinterpret the Pallesen example in the text after pooling the
higher-order interactions to estimate the error variance according to your own judgment.
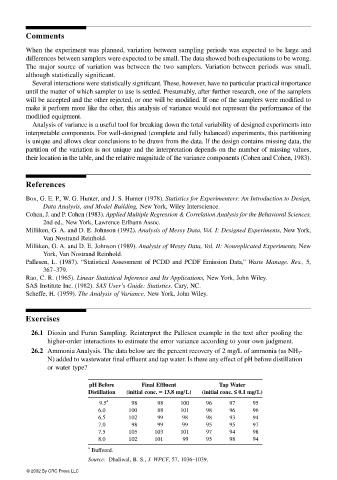
26.2 Ammonia Analysis. The data below are the percent recovery of 2 mg/L of ammonia (as NH 3 -
N) added to wastewater final effluent and tap water. Is there any effect of pH before distillation
or water type?
pH Before Final Effluent Tap Water
Distillation (initial conc. == == 13.8 mg/L) (initial conc. ≤≤ ≤≤ 0.1 mg/L)
9.5 a 98 98 100 96 97 95
6.0 100 88 101 98 96 96
6.5 102 99 98 98 93 94
7.0 98 99 99 95 95 97
7.5 105 103 101 97 94 98
8.0 102 101 99 95 98 94
a
Buffered.
Source: Dhaliwal, B. S., J. WPCF, 57, 1036–1039.
© 2002 By CRC Press LLC