
Page 239 - Statistics for Environmental Engineers
P. 239
L1592_frame_C27.fm Page 242 Tuesday, December 18, 2001 2:47 PM
TABLE 27.3
3
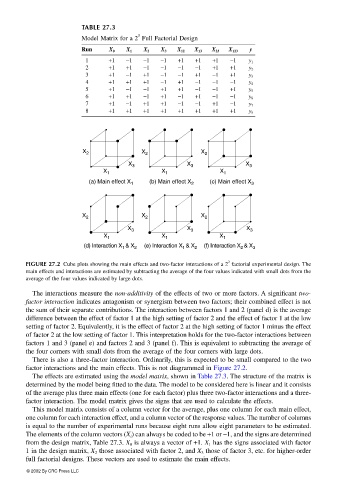
Model Matrix for a 2 Full Factorial Design
Run X 0 X 1 X 2 X 3 X 12 X 13 X 23 X 123 y
1 +1 −1 −1 −1 +1 +1 +1 −1 y 1
2 +1 +1 −1 −1 −1 −1 +1 +1 y 2
3 +1 −1 +1 −1 −1 +1 −1 +1 y 3
4 +1 +1 +1 −1 +1 −1 −1 −1 y 4
5 +1 −1 −1 +1 +1 −1 −1 +1 y 5
6 +1 +1 −1 +1 −1 +1 −1 −1 y 6
7 +1 −1 +1 +1 −1 −1 +1 −1 y 7
8 +1 +1 +1 +1 +1 +1 +1 +1 y 8
X 2 X 2 X 2
X 3 X 3 X 3
X 1 X 1 X 1
(a) Main effect X 1 (b) Main effect X 2 (c) Main effect X 3
X 2 X 2 X 2
X 3 X 3 X 3
X 1 X 1 X 1
(d) Interaction X 1 & X 2 (e) Interaction X 1 & X 2 (f) Interaction X 2 & X 3
3
FIGURE 27.2 Cube plots showing the main effects and two-factor interactions of a 2 factorial experimental design. The
main effects and interactions are estimated by subtracting the average of the four values indicated with small dots from the
average of the four values indicated by large dots.
The interactions measure the non-additivity of the effects of two or more factors. A significant two-
factor interaction indicates antagonism or synergism between two factors; their combined effect is not
the sum of their separate contributions. The interaction between factors 1 and 2 (panel d) is the average
difference between the effect of factor 1 at the high setting of factor 2 and the effect of factor 1 at the low
setting of factor 2. Equivalently, it is the effect of factor 2 at the high setting of factor 1 minus the effect
of factor 2 at the low setting of factor 1. This interpretation holds for the two-factor interactions between
factors 1 and 3 (panel e) and factors 2 and 3 (panel f). This is equivalent to subtracting the average of
the four corners with small dots from the average of the four corners with large dots.
There is also a three-factor interaction. Ordinarily, this is expected to be small compared to the two
factor interactions and the main effects. This is not diagrammed in Figure 27.2.
The effects are estimated using the model matrix, shown in Table 27.3. The structure of the matrix is
determined by the model being fitted to the data. The model to be considered here is linear and it consists
of the average plus three main effects (one for each factor) plus three two-factor interactions and a three-
factor interaction. The model matrix gives the signs that are used to calculate the effects.
This model matrix consists of a column vector for the average, plus one column for each main effect,
one column for each interaction effect, and a column vector of the response values. The number of columns
is equal to the number of experimental runs because eight runs allow eight parameters to be estimated.
The elements of the column vectors (X i ) can always be coded to be +1 or −1, and the signs are determined
from the design matrix, Table 27.3. X 0 is always a vector of +1. X 1 has the signs associated with factor
1 in the design matrix, X 2 those associated with factor 2, and X 3 those of factor 3, etc. for higher-order
full factorial designs. These vectors are used to estimate the main effects.
© 2002 By CRC Press LLC