Page 300 - Statistics for Environmental Engineers
P. 300

L1592_frame_C34  Page 306  Tuesday, December 18, 2001  2:52 PM


                        TABLE 34.1
                        HPLC Calibration Data (in run order from left to right)
                        Dye Conc.       0.18    0.35   0.055    0.022   0.29    0.15    0.044   0.028
                        HPLC Peak Area  26.666  50.651  9.628   4.634  40.206  21.369   5.948   4.245

                        Dye Conc.      0.044    0.073   0.13    0.088   0.26    0.16    0.10
                        HPLC Peak Area  4.786  11.321  18.456  12.865  35.186  24.245  14.175
                        Source:  Bailey, C. J., E. A. Cox, and J. A. Springer (1978). J. Assoc. Off. Anal. Chem., 61, 1404–1414.


                                  TABLE 34.2
                                  Results of the Linear Regression Analysis
                                                       Standard               P
                                  Variable  Coefficient  Error       t       (2-tail)
                                  Constant     0.566    0.473      1.196    0.252
                                  x          139.759    2.889     48.38     0.000

                                  Analysis of Variance
                                             Sum of   Degrees of  Mean
                                  Source     Squares   Freedom   Square    F-Ratio     P
                                  Regression  2794.309    1      2794.309   2340    0.000000
                                  Residual    15.523     13        1.194


                                                             Fitted model
                                                  50
                                                        y = 0.556 + 139.759x
                                                 HPLC Peak Area  30   mean response
                                                     95% confidence
                                                  40
                                                     interval for the
                                                  20

                                                  10            95% confidence
                                                                interval for
                                                                future values
                                                   0
                                                    0           0.1          0.2          0.3          0.4
                                                          Dye Concentration
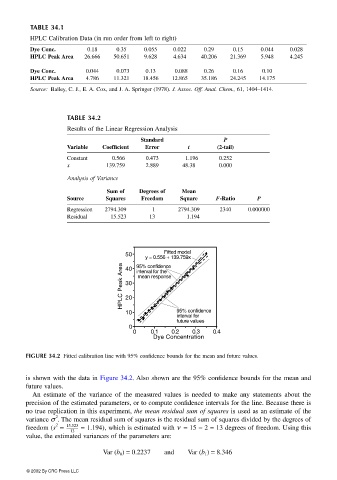
                       FIGURE 34.2 Fitted calibration line with 95% confidence bounds for the mean and future values.


                       is shown with the data in Figure 34.2. Also shown are the 95% confidence bounds for the mean and
                       future values.
                        An estimate of the  variance of the measured  values is needed to make any statements about the
                       precision of the estimated parameters, or to compute confidence intervals for the line. Because there is
                       no true replication in this experiment, the mean residual sum of squares is used as an estimate of the
                               2
                       variance σ . The mean residual sum of squares is the residual sum of squares divided by the degrees of
                               2  15.523
                       freedom (s  = ----------------  = 1.194), which is estimated with ν  = 15 − 2 = 13 degrees of freedom. Using this
                                   13
                       value, the estimated variances of the parameters are:
                                            Var (b 0 ) = 0.2237  and  Var (b 1 ) = 8.346

                       © 2002 By CRC Press LLC
   295   296   297   298   299   300   301   302   303   304   305