
Page 303 - Statistics for Environmental Engineers
P. 303
L1592_frame_C34 Page 309 Tuesday, December 18, 2001 2:52 PM
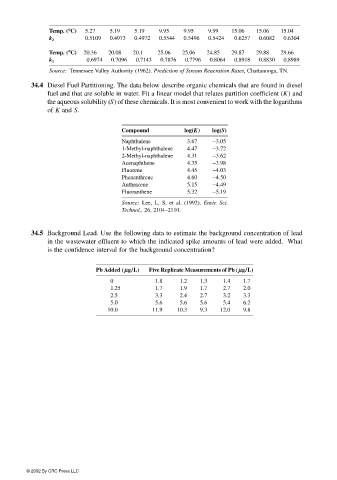
Temp. (°° °°C) 5.27 5.19 5.19 9.95 9.95 9.99 15.06 15.06 15.04
0.5109 0.4973 0.4972 0.5544 0.5496 0.5424 0.6257 0.6082 0.6304
k 2
Temp. (°° °°C) 20.36 20.08 20.1 25.06 25.06 24.85 29.87 29.88 29.66
0.6974 0.7096 0.7143 0.7876 0.7796 0.8064 0.8918 0.8830 0.8989
k 2
Source: Tennessee Valley Authority (1962). Prediction of Stream Reaeration Rates, Chattanooga, TN.
34.4 Diesel Fuel Partitioning. The data below describe organic chemicals that are found in diesel
fuel and that are soluble in water. Fit a linear model that relates partition coefficient (K) and
the aqueous solubility (S) of these chemicals. It is most convenient to work with the logarithms
of K and S.
Compound log(K) log(S)
Naphthalene 3.67 −3.05
1-Methyl-naphthalene 4.47 −3.72
2-Methyl-naphthalene 4.31 −3.62
Acenaphthene 4.35 −3.98
Fluorene 4.45 −4.03
Phenanthrene 4.60 −4.50
Anthracene 5.15 −4.49
Fluoranthene 5.32 −5.19
Source: Lee, L. S. et al. (1992). Envir. Sci.
Technol., 26, 2104–2110.
34.5 Background Lead. Use the following data to estimate the background concentration of lead
in the wastewater effluent to which the indicated spike amounts of lead were added. What
is the confidence interval for the background concentration?
Pb Added (µµ µµg/L) Five Replicate Measurements of Pb (µµ µµg/L)
0 1.8 1.2 1.3 1.4 1.7
1.25 1.7 1.9 1.7 2.7 2.0
2.5 3.3 2.4 2.7 3.2 3.3
5.0 5.6 5.6 5.6 5.4 6.2
10.0 11.9 10.3 9.3 12.0 9.8
© 2002 By CRC Press LLC