
Page 114 -
P. 114
80 PART 2 • STRATEGY FORMULATION
Industry Analysis: The External Factor Evaluation
(EFE) Matrix
An External Factor Evaluation (EFE) Matrix allows strategists to summarize and evaluate
economic, social, cultural, demographic, environmental, political, governmental, legal,
technological, and competitive information. Illustrated in Table 3-12, the EFE Matrix can
be developed in five steps:
1. List key external factors as identified in the external-audit process. Include a total of
15 to 20 factors, including both opportunities and threats, that affect the firm and its
industry. List the opportunities first and then the threats. Be as specific as possible,
using percentages, ratios, and comparative numbers whenever possible. Recall that
Edward Deming said, “In God we trust. Everyone else bring data.”
2. Assign to each factor a weight that ranges from 0.0 (not important) to 1.0 (very
important). The weight indicates the relative importance of that factor to being
successful in the firm’s industry. Opportunities often receive higher weights than
threats, but threats can receive high weights if they are especially severe or threaten-
ing. Appropriate weights can be determined by comparing successful with unsuc-
cessful competitors or by discussing the factor and reaching a group consensus.
The sum of all weights assigned to the factors must equal 1.0.
3. Assign a rating between 1 and 4 to each key external factor to indicate how effec-
tively the firm’s current strategies respond to the factor, where 4 = the response
is superior, 3 = the response is above average, 2 = the response is average, and
1 = the response is poor. Ratings are based on effectiveness of the firm’s strategies.
Ratings are thus company-based, whereas the weights in Step 2 are industry-based.
It is important to note that both threats and opportunities can receive a 1, 2, 3, or 4.
4. Multiply each factor’s weight by its rating to determine a weighted score.
5. Sum the weighted scores for each variable to determine the total weighted score for
the organization.
Regardless of the number of key opportunities and threats included in an EFE Matrix,
the highest possible total weighted score for an organization is 4.0 and the lowest possible
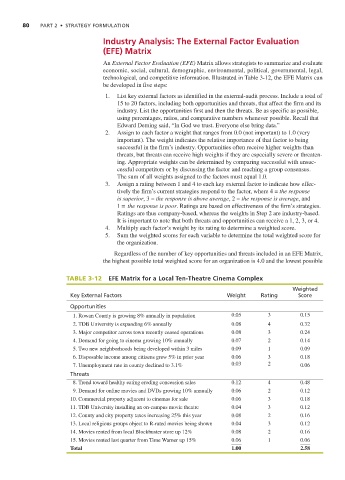
TABLE 3-12 EFE Matrix for a Local Ten-Theatre Cinema Complex
Weighted
Key External Factors Weight Rating Score
Opportunities
1. Rowan County is growing 8% annually in population 0.05 3 0.15
2. TDB University is expanding 6% annually 0.08 4 0.32
3. Major competitor across town recently ceased operations 0.08 3 0.24
4. Demand for going to cinema growing 10% annually 0.07 2 0.14
5. Two new neighborhoods being developed within 3 miles 0.09 1 0.09
6. Disposable income among citizens grew 5% in prior year 0.06 3 0.18
7. Unemployment rate in county declined to 3.1% 0.03 2 0.06
Threats
8. Trend toward healthy eating eroding concession sales 0.12 4 0.48
9. Demand for online movies and DVDs growing 10% annually 0.06 2 0.12
10. Commercial property adjacent to cinemas for sale 0.06 3 0.18
11. TDB University installing an on-campus movie theatre 0.04 3 0.12
12. County and city property taxes increasing 25% this year 0.08 2 0.16
13. Local religious groups object to R-rated movies being shown 0.04 3 0.12
14. Movies rented from local Blockbuster store up 12% 0.08 2 0.16
15. Movies rented last quarter from Time Warner up 15% 0.06 1 0.06
Total 1.00 2.58