
Page 115 -
P. 115
CHAPTER 3 • THE EXTERNAL ASSESSMENT 81
total weighted score is 1.0. The average total weighted score is 2.5. A total weighted score
of 4.0 indicates that an organization is responding in an outstanding way to existing oppor-
tunities and threats in its industry. In other words, the firm’s strategies effectively take
advantage of existing opportunities and minimize the potential adverse effects of external
threats. A total score of 1.0 indicates that the firm’s strategies are not capitalizing on
opportunities or avoiding external threats.
An example of an EFE Matrix is provided in Table 3-12 for a local ten-theatre cinema
complex. Note that the most important factor to being successful in this business is “Trend
toward healthy eating eroding concession sales” as indicated by the 0.12 weight. Also note
that the local cinema is doing excellent in regard to handling two factors, “TDB University
is expanding 6 percent annually” and “Trend toward healthy eating eroding concession
sales.” Perhaps the cinema is placing flyers on campus and also adding yogurt and healthy
drinks to its concession menu. Note that you may have a 1, 2, 3, or 4 anywhere down the
Rating column. Note also that the factors are stated in quantitative terms to the extent
possible, rather than being stated in vague terms. Quantify the factors as much as possible
in constructing an EFE Matrix. Finally, note that the total weighted score of 2.58 is above
the average (midpoint) of 2.5, so this cinema business is doing pretty well, taking advan-
tage of the external opportunities and avoiding the threats facing the firm. There is
definitely room for improvement, though, because the highest total weighted score would
be 4.0. As indicated by ratings of 1, this business needs to capitalize more on the “two new
neighborhoods nearby” opportunity and the “movies rented from Time Warner” threat.
Note also that there are many percentage-based factors among the group. Be quantitative to
the extent possible! Note also that the ratings range from 1 to 4 on both the opportunities
and threats.
The Competitive Profile Matrix (CPM)
The Competitive Profile Matrix (CPM) identifies a firm’s major competitors and its partic-
ular strengths and weaknesses in relation to a sample firm’s strategic position. The weights
and total weighted scores in both a CPM and an EFE have the same meaning. However,
critical success factors in a CPM include both internal and external issues; therefore, the
ratings refer to strengths and weaknesses, where 4 = major strength, 3 = minor strength,
2 = minor weakness, and 1 = major weakness. The critical success factors in a CPM are not
grouped into opportunities and threats as they are in an EFE. In a CPM, the ratings and
total weighted scores for rival firms can be compared to the sample firm. This comparative
analysis provides important internal strategic information.
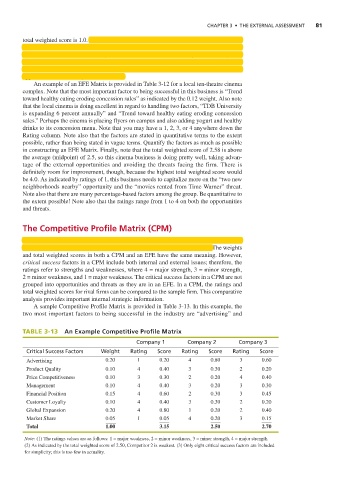
A sample Competitive Profile Matrix is provided in Table 3-13. In this example, the
two most important factors to being successful in the industry are “advertising” and
TABLE 3-13 An Example Competitive Profile Matrix
Company 1 Company 2 Company 3
Critical Success Factors Weight Rating Score Rating Score Rating Score
Advertising 0.20 1 0.20 4 0.80 3 0.60
Product Quality 0.10 4 0.40 3 0.30 2 0.20
Price Competitiveness 0.10 3 0.30 2 0.20 4 0.40
Management 0.10 4 0.40 3 0.20 3 0.30
Financial Position 0.15 4 0.60 2 0.30 3 0.45
Customer Loyalty 0.10 4 0.40 3 0.30 2 0.20
Global Expansion 0.20 4 0.80 1 0.20 2 0.40
Market Share 0.05 1 0.05 4 0.20 3 0.15
Total 1.00 3.15 2.50 2.70
Note: (1) The ratings values are as follows: 1 = major weakness, 2 = minor weakness, 3 = minor strength, 4 = major strength.
(2) As indicated by the total weighted score of 2.50, Competitor 2 is weakest. (3) Only eight critical success factors are included
for simplicity; this is too few in actuality.