
Page 116 -
P. 116
82 PART 2 • STRATEGY FORMULATION
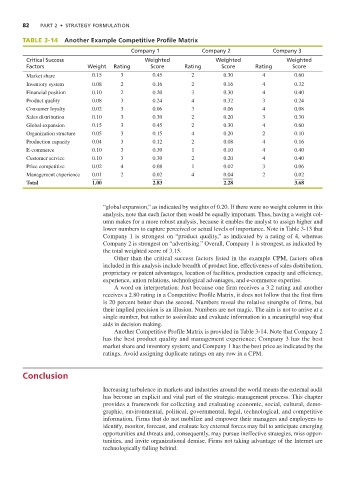
TABLE 3-14 Another Example Competitive Profile Matrix
Company 1 Company 2 Company 3
Critical Success Weighted Weighted Weighted
Factors Weight Rating Score Rating Score Rating Score
Market share 0.15 3 0.45 2 0.30 4 0.60
Inventory system 0.08 2 0.16 2 0.16 4 0.32
Financial position 0.10 2 0.20 3 0.30 4 0.40
Product quality 0.08 3 0.24 4 0.32 3 0.24
Consumer loyalty 0.02 3 0.06 3 0.06 4 0.08
Sales distribution 0.10 3 0.30 2 0.20 3 0.30
Global expansion 0.15 3 0.45 2 0.30 4 0.60
Organization structure 0.05 3 0.15 4 0.20 2 0.10
Production capacity 0.04 3 0.12 2 0.08 4 0.16
E-commerce 0.10 3 0.30 1 0.10 4 0.40
Customer service 0.10 3 0.30 2 0.20 4 0.40
Price competitive 0.02 4 0.08 1 0.02 3 0.06
Management experience 0.01 2 0.02 4 0.04 2 0.02
Total 1.00 2.83 2.28 3.68
“global expansion,” as indicated by weights of 0.20. If there were no weight column in this
analysis, note that each factor then would be equally important. Thus, having a weight col-
umn makes for a more robust analysis, because it enables the analyst to assign higher and
lower numbers to capture perceived or actual levels of importance. Note in Table 3-13 that
Company 1 is strongest on “product quality,” as indicated by a rating of 4, whereas
Company 2 is strongest on “advertising.” Overall, Company 1 is strongest, as indicated by
the total weighted score of 3.15.
Other than the critical success factors listed in the example CPM, factors often
included in this analysis include breadth of product line, effectiveness of sales distribution,
proprietary or patent advantages, location of facilities, production capacity and efficiency,
experience, union relations, technological advantages, and e-commerce expertise.
A word on interpretation: Just because one firm receives a 3.2 rating and another
receives a 2.80 rating in a Competitive Profile Matrix, it does not follow that the first firm
is 20 percent better than the second. Numbers reveal the relative strengths of firms, but
their implied precision is an illusion. Numbers are not magic. The aim is not to arrive at a
single number, but rather to assimilate and evaluate information in a meaningful way that
aids in decision making.
Another Competitive Profile Matrix is provided in Table 3-14. Note that Company 2
has the best product quality and management experience; Company 3 has the best
market share and inventory system; and Company 1 has the best price as indicated by the
ratings. Avoid assigning duplicate ratings on any row in a CPM.
Conclusion
Increasing turbulence in markets and industries around the world means the external audit
has become an explicit and vital part of the strategic-management process. This chapter
provides a framework for collecting and evaluating economic, social, cultural, demo-
graphic, environmental, political, governmental, legal, technological, and competitive
information. Firms that do not mobilize and empower their managers and employees to
identify, monitor, forecast, and evaluate key external forces may fail to anticipate emerging
opportunities and threats and, consequently, may pursue ineffective strategies, miss oppor-
tunities, and invite organizational demise. Firms not taking advantage of the Internet are
technologically falling behind.