
Page 220 -
P. 220
186 PART 2 • STRATEGY FORMULATION
TABLE 6-5 Market Share Data for Selected Industries in 2009
U.S. Top Five Airlines by Number of Passengers Boarded in 2008 (in millions; estimate)
Southwest 7.5
American 5.0
Delta 4.5
United 4.0
US Airways 3.5
U.S. Top Five Imported Beers in 2008 (in millions of barrels imported)
Corona Extra 8.0
Heineken 5.0
Modelo Especial 2.0
Tecate 1.5
Guinness 1.0
Source: Based on David Kesmodel, “U.S. Beer Imports Lose Their Fizz,” Wall Street Journal (February 20, 2009):
B5; S&P Industry Surveys and Company Form 10-K Reports.
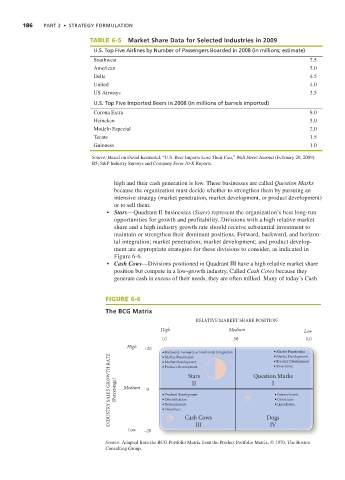
high and their cash generation is low. These businesses are called Question Marks
because the organization must decide whether to strengthen them by pursuing an
intensive strategy (market penetration, market development, or product development)
or to sell them.
• Stars—Quadrant II businesses (Stars) represent the organization’s best long-run
opportunities for growth and profitability. Divisions with a high relative market
share and a high industry growth rate should receive substantial investment to
maintain or strengthen their dominant positions. Forward, backward, and horizon-
tal integration; market penetration; market development; and product develop-
ment are appropriate strategies for these divisions to consider, as indicated in
Figure 6-6.
• Cash Cows—Divisions positioned in Quadrant III have a high relative market share
position but compete in a low-growth industry. Called Cash Cows because they
generate cash in excess of their needs, they are often milked. Many of today’s Cash
FIGURE 6-6
The BCG Matrix
RELATIVE MARKET SHARE POSITION
High Medium Low
1.0 .50 0.0
High
+20
• Backward, Forward, or Horizontal Integration • Market Penetration
INDUSTRY SALES GROWTH RATE (Percentage) Medium 0 • Product Development Question Marks
• Market Development
• Market Penetration
• Product Development
• Market Development
• Divestiture
• Product Development
Stars
II
I
• Retrenchment
• Diversification
• Divestiture
• Liquidation
• Retrenchment
• Divestiture
III
IV
Low –20 Cash Cows Dogs
Source: Adapted from the BCG Portfolio Matrix from the Product Portfolio Matrix, © 1970, The Boston
Consulting Group.