
Page 223 -
P. 223
CHAPTER 6 • STRATEGY ANALYSIS AND CHOICE 189
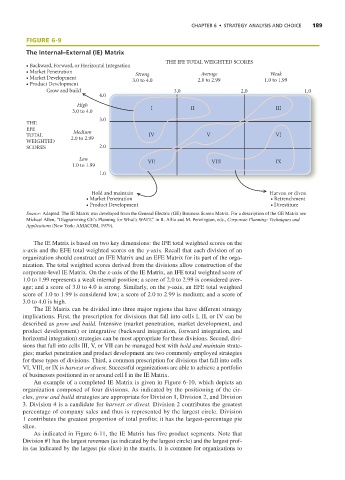
FIGURE 6-9
The Internal–External (IE) Matrix
THE IFE TOTAL WEIGHTED SCORES
• Backward, Forward, or Horizontal Integration
• Market Penetration Strong Average Weak
• Market Development 3.0 to 4.0 2.0 to 2.99 1.0 to 1.99
• Product Development
Grow and build 3.0 2.0 1.0
4.0
High
3.0 to 4.0 I II III
3.0
THE
EFE Medium
TOTAL 2.0 to 2.99 IV V VI
WEIGHTED
SCORES 2.0
Low
1.0 to 1.99 VII VIII IX
1.0
Hold and maintain Harvest or divest
• Market Penetration • Retrenchment
• Product Development • Divestiture
Source: Adapted. The IE Matrix was developed from the General Electric (GE) Business Screen Matrix. For a description of the GE Matrix see
Michael Allen, “Diagramming GE’s Planning for What’s WATT,” in R. Allio and M. Pennington, eds., Corporate Planning: Techniques and
Applications (New York: AMACOM, 1979).
The IE Matrix is based on two key dimensions: the IFE total weighted scores on the
x-axis and the EFE total weighted scores on the y-axis. Recall that each division of an
organization should construct an IFE Matrix and an EFE Matrix for its part of the orga-
nization. The total weighted scores derived from the divisions allow construction of the
corporate-level IE Matrix. On the x-axis of the IE Matrix, an IFE total weighted score of
1.0 to 1.99 represents a weak internal position; a score of 2.0 to 2.99 is considered aver-
age; and a score of 3.0 to 4.0 is strong. Similarly, on the y-axis, an EFE total weighted
score of 1.0 to 1.99 is considered low; a score of 2.0 to 2.99 is medium; and a score of
3.0 to 4.0 is high.
The IE Matrix can be divided into three major regions that have different strategy
implications. First, the prescription for divisions that fall into cells I, II, or IV can be
described as grow and build. Intensive (market penetration, market development, and
product development) or integrative (backward integration, forward integration, and
horizontal integration) strategies can be most appropriate for these divisions. Second, divi-
sions that fall into cells III, V, or VII can be managed best with hold and maintain strate-
gies; market penetration and product development are two commonly employed strategies
for these types of divisions. Third, a common prescription for divisions that fall into cells
VI, VIII, or IX is harvest or divest. Successful organizations are able to achieve a portfolio
of businesses positioned in or around cell I in the IE Matrix.
An example of a completed IE Matrix is given in Figure 6-10, which depicts an
organization composed of four divisions. As indicated by the positioning of the cir-
cles, grow and build strategies are appropriate for Division 1, Division 2, and Division
3. Division 4 is a candidate for harvest or divest. Division 2 contributes the greatest
percentage of company sales and thus is represented by the largest circle. Division
1 contributes the greatest proportion of total profits; it has the largest-percentage pie
slice.
As indicated in Figure 6-11, the IE Matrix has five product segments. Note that
Division #1 has the largest revenues (as indicated by the largest circle) and the largest prof-
its (as indicated by the largest pie slice) in the matrix. It is common for organizations to