
Page 225 -
P. 225
CHAPTER 6 • STRATEGY ANALYSIS AND CHOICE 191
develop both geographic and product-based IE Matrices to more effectively formulate
strategies and allocate resources among divisions. In addition, firms often prepare an IE (or
BCG) Matrix for competitors. Furthermore, firms will often prepare “before and after” IE
(or BCG) Matrices to reveal the situation at present versus the expected situation after one
year. This latter idea minimizes the limitation of these matrices being a “snapshot in time.”
In performing case analysis, feel free to estimate the IFE and EFE scores for the various
divisions based upon your research into the company and industry—rather than preparing
a separate IE Matrix for each division.
The Grand Strategy Matrix
In addition to the SWOT Matrix, SPACE Matrix, BCG Matrix, and IE Matrix, the Grand
Strategy Matrix has become a popular tool for formulating alternative strategies. All orga-
nizations can be positioned in one of the Grand Strategy Matrix’s four strategy quadrants.
A firm’s divisions likewise could be positioned. As illustrated in Figure 6-12, the Grand
Strategy Matrix is based on two evaluative dimensions: competitive position and market
(industry) growth. Any industry whose annual growth in sales exceeds 5 percent could be
considered to have rapid growth. Appropriate strategies for an organization to consider are
listed in sequential order of attractiveness in each quadrant of the matrix.
Firms located in Quadrant I of the Grand Strategy Matrix are in an excellent strategic
position. For these firms, continued concentration on current markets (market penetration
and market development) and products (product development) is an appropriate strategy. It
is unwise for a Quadrant I firm to shift notably from its established competitive advan-
tages. When a Quadrant I organization has excessive resources, then backward, forward, or
horizontal integration may be effective strategies. When a Quadrant I firm is too heavily
committed to a single product, then related diversification may reduce the risks associated
with a narrow product line. Quadrant I firms can afford to take advantage of external
opportunities in several areas. They can take risks aggressively when necessary.
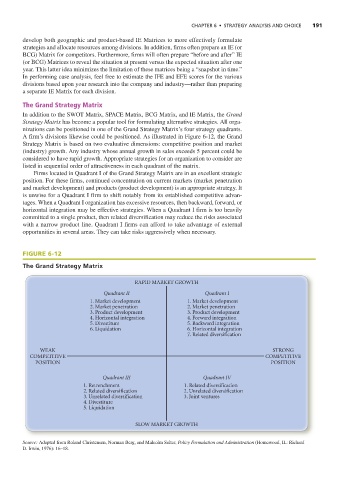
FIGURE 6-12
The Grand Strategy Matrix
RAPID MARKET GROWTH
Quadrant II Quadrant I
1. Market development 1. Market development
2. Market penetration 2. Market penetration
3. Product development 3. Product development
4. Horizontal integration 4. Forward integration
5. Divestiture 5. Backward integration
6. Liquidation 6. Horizontal integration
7. Related diversification
WEAK STRONG
COMPETITIVE COMPETITIVE
POSITION POSITION
Quadrant III Quadrant IV
1. Retrenchment 1. Related diversification
2. Related diversification 2. Unrelated diversification
3. Unrelated diversification 3. Joint ventures
4. Divestiture
5. Liquidation
SLOW MARKET GROWTH
Source: Adapted from Roland Christensen, Norman Berg, and Malcolm Salter, Policy Formulation and Administration (Homewood, IL: Richard
D. Irwin, 1976): 16–18.