
Page 221 -
P. 221
CHAPTER 6 • STRATEGY ANALYSIS AND CHOICE 187
Cows were yesterday’s Stars. Cash Cow divisions should be managed to maintain
their strong position for as long as possible. Product development or diversification
may be attractive strategies for strong Cash Cows. However, as a Cash Cow division
becomes weak, retrenchment or divestiture can become more appropriate.
• Dogs—Quadrant IV divisions of the organization have a low relative market share
position and compete in a slow- or no-market-growth industry; they are Dogs in the
firm’s portfolio. Because of their weak internal and external position, these busi-
nesses are often liquidated, divested, or trimmed down through retrenchment. When
a division first becomes a Dog, retrenchment can be the best strategy to pursue
because many Dogs have bounced back, after strenuous asset and cost reduction,
to become viable, profitable divisions.
The major benefit of the BCG Matrix is that it draws attention to the cash flow, invest-
ment characteristics, and needs of an organization’s various divisions. The divisions of
many firms evolve over time: Dogs become Question Marks, Question Marks become
Stars, Stars become Cash Cows, and Cash Cows become Dogs in an ongoing counter-
clockwise motion. Less frequently, Stars become Question Marks, Question Marks
become Dogs, Dogs become Cash Cows, and Cash Cows become Stars (in a clockwise
motion). In some organizations, no cyclical motion is apparent. Over time, organizations
should strive to achieve a portfolio of divisions that are Stars.
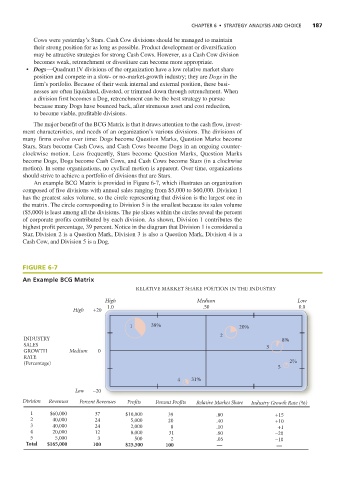
An example BCG Matrix is provided in Figure 6-7, which illustrates an organization
composed of five divisions with annual sales ranging from $5,000 to $60,000. Division 1
has the greatest sales volume, so the circle representing that division is the largest one in
the matrix. The circle corresponding to Division 5 is the smallest because its sales volume
($5,000) is least among all the divisions. The pie slices within the circles reveal the percent
of corporate profits contributed by each division. As shown, Division 1 contributes the
highest profit percentage, 39 percent. Notice in the diagram that Division 1 is considered a
Star, Division 2 is a Question Mark, Division 3 is also a Question Mark, Division 4 is a
Cash Cow, and Division 5 is a Dog.
FIGURE 6-7
An Example BCG Matrix
RELATIVE MARKET SHARE POSITION IN THE INDUSTRY
High Medium Low
1.0 .50 0.0
High +20
1 39% 20%
2
INDUSTRY 8%
SALES 3
GROWTH Medium 0
RATE
(Percentage) 2%
5
4 31%
Low –20
Division Revenues Percent Revenues Profits Percent Profits Relative Market Share Industry Growth Rate (%)
1 $60,000 37 $10,000 39 .80 +15
2 40,000 24 5,000 20 .40 +10
3 40,000 24 2,000 8 .10 +1
4 20,000 12 8,000 31 .60 –20
5 5,000 3 500 2 .05 –10
Total $165,000 100 $25,500 100 — —