
Page 222 -
P. 222
188 PART 2 • STRATEGY FORMULATION
The BCG Matrix, like all analytical techniques, has some limitations. For example,
viewing every business as either a Star, Cash Cow, Dog, or Question Mark is an oversimpli-
fication; many businesses fall right in the middle of the BCG Matrix and thus are not easily
classified. Furthermore, the BCG Matrix does not reflect whether or not various divisions or
their industries are growing over time; that is, the matrix has no temporal qualities, but rather
it is a snapshot of an organization at a given point in time. Finally, other variables besides
relative market share position and industry growth rate in sales, such as size of the market and
competitive advantages, are important in making strategic decisions about various divisions.
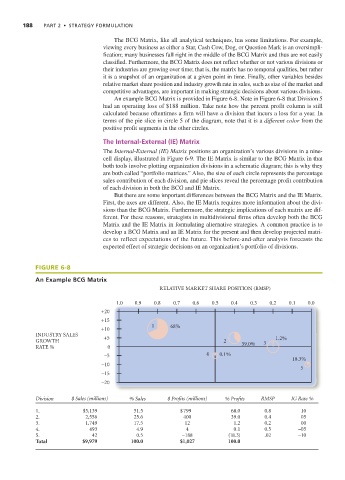
An example BCG Matrix is provided in Figure 6-8. Note in Figure 6-8 that Division 5
had an operating loss of $188 million. Take note how the percent profit column is still
calculated because oftentimes a firm will have a division that incurs a loss for a year. In
terms of the pie slice in circle 5 of the diagram, note that it is a different color from the
positive profit segments in the other circles.
The Internal-External (IE) Matrix
The Internal-External (IE) Matrix positions an organization’s various divisions in a nine-
cell display, illustrated in Figure 6-9. The IE Matrix is similar to the BCG Matrix in that
both tools involve plotting organization divisions in a schematic diagram; this is why they
are both called “portfolio matrices.” Also, the size of each circle represents the percentage
sales contribution of each division, and pie slices reveal the percentage profit contribution
of each division in both the BCG and IE Matrix.
But there are some important differences between the BCG Matrix and the IE Matrix.
First, the axes are different. Also, the IE Matrix requires more information about the divi-
sions than the BCG Matrix. Furthermore, the strategic implications of each matrix are dif-
ferent. For these reasons, strategists in multidivisional firms often develop both the BCG
Matrix and the IE Matrix in formulating alternative strategies. A common practice is to
develop a BCG Matrix and an IE Matrix for the present and then develop projected matri-
ces to reflect expectations of the future. This before-and-after analysis forecasts the
expected effect of strategic decisions on an organization’s portfolio of divisions.
FIGURE 6-8
An Example BCG Matrix
RELATIVE MARKET SHARE POSITION (RMSP)
1.0 0.9 0.8 0.7 0.6 0.5 0.4 0.3 0.2 0.1 0.0
+20
+15
1 68%
+10
INDUSTRY SALES +5
GROWTH 2 39.0% 3 1.2%
RATE % 0
–5 4 0.1%
18.3%
–10
5
–15
–20
Division $ Sales (millions) % Sales $ Profits (millions) % Profits RMSP IG Rate %
1. $5,139 51.5 $ 799 68.0 0.8 10
2. 2,556 25.6 400 39.0 0.4 05
3. 1,749 17.5 12 1.2 0.2 00
4. 493 4.9 4 0.1 0.5 –05
5. 42 0.5 –188 (18.3) .02 –10
Total $9,979 100.0 $1,027 100.0