
Page 296 -
P. 296
262 PART 3 • STRATEGY IMPLEMENTATION
Acquiring Capital to Implement Strategies
Successful strategy implementation often requires additional capital. Besides net
profit from operations and the sale of assets, two basic sources of capital for an
organization are debt and equity. Determining an appropriate mix of debt and equity
in a firm’s capital structure can be vital to successful strategy implementation. An
Earnings Per Share/Earnings Before Interest and Taxes (EPS/EBIT) analysis is the
most widely used technique for determining whether debt, stock, or a combination of
debt and stock is the best alternative for raising capital to implement strategies. This
technique involves an examination of the impact that debt versus stock financing has
on earnings per share under various assumptions as to EBIT.
Theoretically, an enterprise should have enough debt in its capital structure to boost its
return on investment by applying debt to products and projects earning more than the cost
of the debt. In low earning periods, too much debt in the capital structure of an organiza-
tion can endanger stockholders’ returns and jeopardize company survival. Fixed debt
obligations generally must be met, regardless of circumstances. This does not mean that
stock issuances are always better than debt for raising capital. Some special concerns with
stock issuances are dilution of ownership, effect on stock price, and the need to share
future earnings with all new shareholders.
Without going into detail on other institutional and legal issues related to the debt
versus stock decision, EPS/EBIT may be best explained by working through an example.
Let’s say the Brown Company needs to raise $1 million to finance implementation of a
market-development strategy. The company’s common stock currently sells for $50 per
share, and 100,000 shares are outstanding. The prime interest rate is 10 percent, and the
company’s tax rate is 50 percent. The company’s earnings before interest and taxes next
year are expected to be $2 million if a recession occurs, $4 million if the economy stays
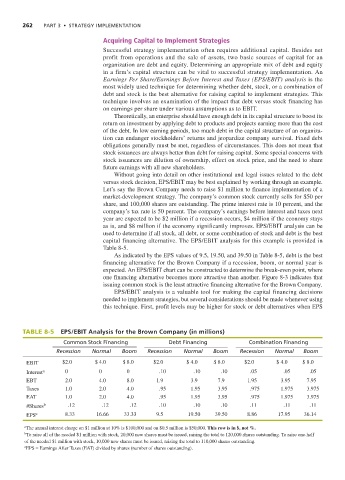
as is, and $8 million if the economy significantly improves. EPS/EBIT analysis can be
used to determine if all stock, all debt, or some combination of stock and debt is the best
capital financing alternative. The EPS/EBIT analysis for this example is provided in
Table 8-5.
As indicated by the EPS values of 9.5, 19.50, and 39.50 in Table 8-5, debt is the best
financing alternative for the Brown Company if a recession, boom, or normal year is
expected. An EPS/EBIT chart can be constructed to determine the break-even point, where
one financing alternative becomes more attractive than another. Figure 8-3 indicates that
issuing common stock is the least attractive financing alternative for the Brown Company.
EPS/EBIT analysis is a valuable tool for making the capital financing decisions
needed to implement strategies, but several considerations should be made whenever using
this technique. First, profit levels may be higher for stock or debt alternatives when EPS
TABLE 8-5 EPS/EBIT Analysis for the Brown Company (in millions)
Common Stock Financing Debt Financing Combination Financing
Recession Normal Boom Recession Normal Boom Recession Normal Boom
EBIT $2.0 $ 4.0 $ 8.0 $2.0 $ 4.0 $ 8.0 $2.0 $ 4.0 $ 8.0
Interest a 0 0 0 .10 .10 .10 .05 .05 .05
EBT 2.0 4.0 8.0 1.9 3.9 7.9 1.95 3.95 7.95
Taxes 1.0 2.0 4.0 .95 1.95 3.95 .975 1.975 3.975
EAT 1.0 2.0 4.0 .95 1.95 3.95 .975 1.975 3.975
#Shares b .12 .12 .12 .10 .10 .10 .11 .11 .11
EPS c 8.33 16.66 33.33 9.5 19.50 39.50 8.86 17.95 36.14
a The annual interest charge on $1 million at 10% is $100,000 and on $0.5 million is $50,000. This row is in $, not %.
b To raise all of the needed $1 million with stock, 20,000 new shares must be issued, raising the total to 120,000 shares outstanding. To raise one-half
of the needed $1 million with stock, 10,000 new shares must be issued, raising the total to 110,000 shares outstanding.
c EPS = Earnings After Taxes (EAT) divided by shares (number of shares outstanding).