
Page 297 -
P. 297
CHAPTER 8 • IMPLEMENTING STRATEGIES: MARKETING, FINANCE/ACCOUNTING, R&D, AND MIS ISSUES 263
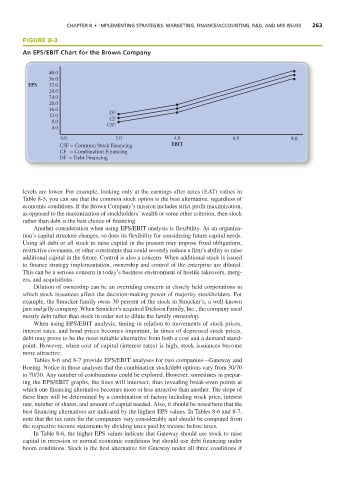
FIGURE 8-3
An EPS/EBIT Chart for the Brown Company
40.0
36.0
EPS 32.0
28.0
24.0
20.0
16.0 DF
12.0 CF
8.0 CSF
4.0
0.0 2.0 4.0 6.0 8.0
CSF = Common Stock Financing EBIT
CF = Combination Financing
DF = Debt Financing
levels are lower. For example, looking only at the earnings after taxes (EAT) values in
Table 8-5, you can see that the common stock option is the best alternative, regardless of
economic conditions. If the Brown Company’s mission includes strict profit maximization,
as opposed to the maximization of stockholders’ wealth or some other criterion, then stock
rather than debt is the best choice of financing.
Another consideration when using EPS/EBIT analysis is flexibility. As an organiza-
tion’s capital structure changes, so does its flexibility for considering future capital needs.
Using all debt or all stock to raise capital in the present may impose fixed obligations,
restrictive covenants, or other constraints that could severely reduce a firm’s ability to raise
additional capital in the future. Control is also a concern. When additional stock is issued
to finance strategy implementation, ownership and control of the enterprise are diluted.
This can be a serious concern in today’s business environment of hostile takeovers, merg-
ers, and acquisitions.
Dilution of ownership can be an overriding concern in closely held corporations in
which stock issuances affect the decision-making power of majority stockholders. For
example, the Smucker family owns 30 percent of the stock in Smucker’s, a well-known
jam and jelly company. When Smucker’s acquired Dickson Family, Inc., the company used
mostly debt rather than stock in order not to dilute the family ownership.
When using EPS/EBIT analysis, timing in relation to movements of stock prices,
interest rates, and bond prices becomes important. In times of depressed stock prices,
debt may prove to be the most suitable alternative from both a cost and a demand stand-
point. However, when cost of capital (interest rates) is high, stock issuances become
more attractive.
Tables 8-6 and 8-7 provide EPS/EBIT analyses for two companies—Gateway and
Boeing. Notice in those analyses that the combination stock/debt options vary from 30/70
to 70/30. Any number of combinations could be explored. However, sometimes in prepar-
ing the EPS/EBIT graphs, the lines will intersect, thus revealing break-even points at
which one financing alternative becomes more or less attractive than another. The slope of
these lines will be determined by a combination of factors including stock price, interest
rate, number of shares, and amount of capital needed. Also, it should be noted here that the
best financing alternatives are indicated by the highest EPS values. In Tables 8-6 and 8-7,
note that the tax rates for the companies vary considerably and should be computed from
the respective income statements by dividing taxes paid by income before taxes.
In Table 8-6, the higher EPS values indicate that Gateway should use stock to raise
capital in recession or normal economic conditions but should use debt financing under
boom conditions. Stock is the best alternative for Gateway under all three conditions if