Page 298 -
P. 298

264    PART 3 • STRATEGY IMPLEMENTATION


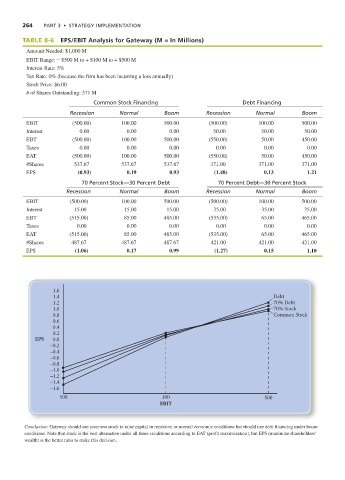
           TABLE 8-6    EPS/EBIT Analysis for Gateway (M = In Millions)
            Amount Needed: $1,000 M
            EBIT Range: - $500 M to + $100 M to + $500 M
            Interest Rate: 5%
            Tax Rate: 0% (because the firm has been incurring a loss annually)
            Stock Price: $6.00
            # of Shares Outstanding: 371 M
                                  Common Stock Financing                           Debt Financing
                           Recession       Normal         Boom         Recession        Normal         Boom
            EBIT            (500.00)        100.00        500.00        (500.00)         100.00        500.00
            Interest          0.00           0.00          0.00           50.00          50.00          50.00
            EBT             (500.00)        100.00        500.00        (550.00)         50.00         450.00
            Taxes             0.00           0.00          0.00            0.00           0.00           0.00
            EAT             (500.00)        100.00        500.00        (550.00)         50.00         450.00
            #Shares         537.67          537.67        537.67         371.00          371.00        371.00
            EPS              (0.93)          0.19          0.93           (1.48)          0.13           1.21
                               70 Percent Stock—30 Percent Debt            70 Percent Debt—30 Percent Stock
                          Recession        Normal         Boom         Recession        Normal         Boom
            EBIT           (500.00)         100.00       500.00         (500.00)         100.00        500.00
            Interest        15.00           15.00         15.00           35.00           35.00         35.00
            EBT            (515.00)         85.00        485.00         (535.00)          65.00        465.00
            Taxes            0.00            0.00          0.00            0.00           0.00          0.00
            EAT            (515.00)         85.00        485.00         (535.00)          65.00        465.00
            #Shares        487.67           487.67       487.67          421.00          421.00        421.00
            EPS             (1.06)           0.17          0.99           (1.27)          0.15          1.10


                     1.6
                     1.4                                                                      Debt
                     1.2                                                                      70% Debt
                     1.0                                                                      70% Stock
                     0.8                                                                      Common Stock
                     0.6
                     0.4
                     0.2
               EPS   0.0
                    –0.2
                    –0.4
                    –0.6
                    –0.8
                    –1.0
                    –1.2
                    –1.4
                    –1.6
                       500                               100                               500
                                                        EBIT


            Conclusion: Gateway should use common stock to raise capital in recession or normal economic conditions but should use debt financing under boom
            conditions. Note that stock is the best alternative under all three conditions according to EAT (profit maximization), but EPS (maximize shareholders’
            wealth) is the better ratio to make this decision.
   293   294   295   296   297   298   299   300   301   302   303