
Page 303 -
P. 303
CHAPTER 8 • IMPLEMENTING STRATEGIES: MARKETING, FINANCE/ACCOUNTING, R&D, AND MIS ISSUES 269
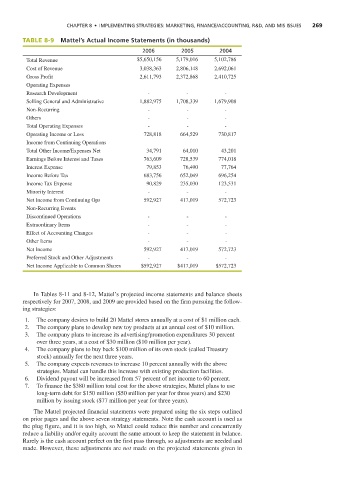
TABLE 8-9 Mattel’s Actual Income Statements (in thousands)
2006 2005 2004
Total Revenue $5,650,156 5,179,016 5,102,786
Cost of Revenue 3,038,363 2,806,148 2,692,061
Gross Profit 2,611,793 2,372,868 2,410,725
Operating Expenses
Research Development - - -
Selling General and Administrative 1,882,975 1,708,339 1,679,908
Non-Recurring - - -
Others - - -
Total Operating Expenses - - -
Operating Income or Loss 728,818 664,529 730,817
Income from Continuing Operations
Total Other Income/Expenses Net 34,791 64,010 43,201
Earnings Before Interest and Taxes 763,609 728,539 774,018
Interest Expense 79,853 76,490 77,764
Income Before Tax 683,756 652,049 696,254
Income Tax Expense 90,829 235,030 123,531
Minority Interest - - -
Net Income from Continuing Ops 592,927 417,019 572,723
Non-Recurring Events
Discontinued Operations - - -
Extraordinary Items - - -
Effect of Accounting Changes - - -
Other Items - - -
Net Income 592,927 417,019 572,723
Preferred Stock and Other Adjustments - - -
Net Income Applicable to Common Shares $592,927 $417,019 $572,723
In Tables 8-11 and 8-12, Mattel’s projected income statements and balance sheets
respectively for 2007, 2008, and 2009 are provided based on the firm pursuing the follow-
ing strategies:
1. The company desires to build 20 Mattel stores annually at a cost of $1 million each.
2. The company plans to develop new toy products at an annual cost of $10 million.
3. The company plans to increase its advertising/promotion expenditures 30 percent
over three years, at a cost of $30 million ($10 million per year).
4. The company plans to buy back $100 million of its own stock (called Treasury
stock) annually for the next three years.
5. The company expects revenues to increase 10 percent annually with the above
strategies. Mattel can handle this increase with existing production facilities.
6. Dividend payout will be increased from 57 percent of net income to 60 percent.
7. To finance the $380 million total cost for the above strategies, Mattel plans to use
long-term debt for $150 million ($50 million per year for three years) and $230
million by issuing stock ($77 million per year for three years).
The Mattel projected financial statements were prepared using the six steps outlined
on prior pages and the above seven strategy statements. Note the cash account is used as
the plug figure, and it is too high, so Mattel could reduce this number and concurrently
reduce a liability and/or equity account the same amount to keep the statement in balance.
Rarely is the cash account perfect on the first pass through, so adjustments are needed and
made. However, these adjustments are not made on the projected statements given in