
Page 305 -
P. 305
CHAPTER 8 • IMPLEMENTING STRATEGIES: MARKETING, FINANCE/ACCOUNTING, R&D, AND MIS ISSUES 271
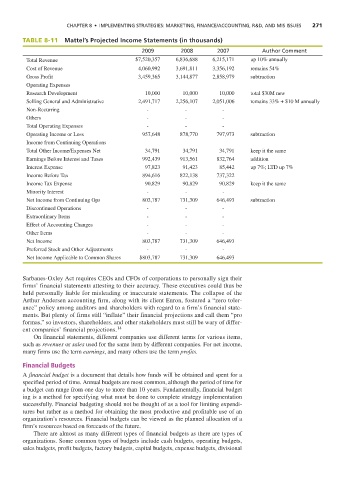
TABLE 8-11 Mattel’s Projected Income Statements (in thousands)
2009 2008 2007 Author Comment
Total Revenue $7,520,357 6,836,688 6,215,171 up 10% annually
Cost of Revenue 4,060,992 3,691,811 3,356,192 remains 54%
Gross Profit 3,459,365 3,144,877 2,858,979 subtraction
Operating Expenses
Research Development 10,000 10,000 10,000 total $30M new
Selling General and Administrative 2,491,717 2,256,107 2,051,006 remains 33% + $10 M annually
Non-Recurring - - -
Others - - -
Total Operating Expenses - - -
Operating Income or Loss 957,648 878,770 797,973 subtraction
Income from Continuing Operations
Total Other Income/Expenses Net 34,791 34,791 34,791 keep it the same
Earnings Before Interest and Taxes 992,439 913,561 832,764 addition
Interest Expense 97,823 91,423 85,442 up 7%; LTD up 7%
Income Before Tax 894,616 822,138 737,322
Income Tax Expense 90,829 90,829 90,829 keep it the same
Minority Interest - - -
Net Income from Continuing Ops 803,787 731,309 646,493 subtraction
Discontinued Operations - - -
Extraordinary Items - - -
Effect of Accounting Changes - - -
Other Items - - -
Net Income 803,787 731,309 646,493
Preferred Stock and Other Adjustments - - -
Net Income Applicable to Common Shares $803,787 731,309 646,493
Sarbanes-Oxley Act requires CEOs and CFOs of corporations to personally sign their
firms’ financial statements attesting to their accuracy. These executives could thus be
held personally liable for misleading or inaccurate statements. The collapse of the
Arthur Andersen accounting firm, along with its client Enron, fostered a “zero toler-
ance” policy among auditors and shareholders with regard to a firm’s financial state-
ments. But plenty of firms still “inflate” their financial projections and call them “pro
formas,” so investors, shareholders, and other stakeholders must still be wary of differ-
ent companies’ financial projections. 14
On financial statements, different companies use different terms for various items,
such as revenues or sales used for the same item by different companies. For net income,
many firms use the term earnings, and many others use the term profits.
Financial Budgets
A financial budget is a document that details how funds will be obtained and spent for a
specified period of time. Annual budgets are most common, although the period of time for
a budget can range from one day to more than 10 years. Fundamentally, financial budget
ing is a method for specifying what must be done to complete strategy implementation
successfully. Financial budgeting should not be thought of as a tool for limiting expendi-
tures but rather as a method for obtaining the most productive and profitable use of an
organization’s resources. Financial budgets can be viewed as the planned allocation of a
firm’s resources based on forecasts of the future.
There are almost as many different types of financial budgets as there are types of
organizations. Some common types of budgets include cash budgets, operating budgets,
sales budgets, profit budgets, factory budgets, capital budgets, expense budgets, divisional