
Page 306 -
P. 306
272 PART 3 • STRATEGY IMPLEMENTATION
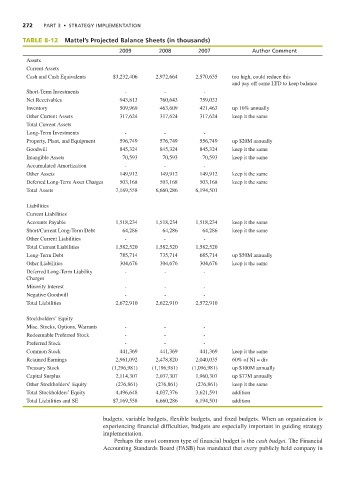
TABLE 8-12 Mattel’s Projected Balance Sheets (in thousands)
2009 2008 2007 Author Comment
Assets
Current Assets
Cash and Cash Equivalents $3,232,406 2,972,664 2,570,635 too high, could reduce this
and pay off some LTD to keep balance
Short-Term Investments - - -
Net Receivables 943,813 760,643 759,033
Inventory 509,969 463,609 421,463 up 10% annually
Other Current Assets 317,624 317,624 317,624 keep it the same
Total Current Assets
Long-Term Investments - - -
Property, Plant, and Equipment 596,749 576,749 556,749 up $20M annually
Goodwill 845,324 845,324 845,324 keep it the same
Intangible Assets 70,593 70,593 70,593 keep it the same
Accumulated Amortization - - -
Other Assets 149,912 149,912 149,912 keep it the same
Deferred Long-Term Asset Charges 503,168 503,168 503,168 keep it the same
Total Assets 7,169,558 6,660,286 6,194,501
Liabilities
Current Liabilities
Accounts Payable 1,518,234 1,518,234 1,518,234 keep it the same
Short/Current Long-Term Debt 64,286 64,286 64,286 keep it the same
Other Current Liabilities - - -
Total Current Liabilities 1,582,520 1,582,520 1,582,520
Long-Term Debt 785,714 735,714 685,714 up $50M annually
Other Liabilities 304,676 304,676 304,676 keep it the same
Deferred Long-Term Liability - - -
Charges
Minority Interest - - -
Negative Goodwill - - -
Total Liabilities 2,672,910 2,622,910 2,572,910
Stockholders’ Equity
Misc. Stocks, Options, Warrants - - -
Redeemable Preferred Stock - - -
Preferred Stock - - -
Common Stock 441,369 441,369 441,369 keep it the same
Retained Earnings 2,961,092 2,478,820 2,040,035 60% of NI = div
Treasury Stock (1,296,981) (1,196,981) (1,096,981) up $100M annually
Capital Surplus 2,114,307 2,037,307 1,960,307 up $77M annually
Other Stockholders’ Equity (276,861) (276,861) (276,861) keep it the same
Total Stockholders’ Equity 4,496,648 4,037,376 3,621,591 addition
Total Liabilities and SE $7,169,558 6,660,286 6,194,501 addition
budgets, variable budgets, flexible budgets, and fixed budgets. When an organization is
experiencing financial difficulties, budgets are especially important in guiding strategy
implementation.
Perhaps the most common type of financial budget is the cash budget. The Financial
Accounting Standards Board (FASB) has mandated that every publicly held company in