Page 304 -
P. 304

270    PART 3 • STRATEGY IMPLEMENTATION


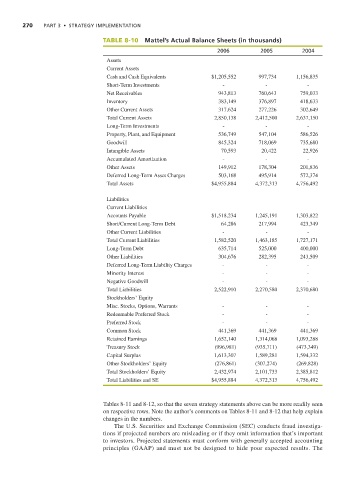
                                      TABLE 8-10   Mattel’s Actual Balance Sheets (in thousands)
                                                                           2006          2005          2004
                                       Assets
                                       Current Assets
                                       Cash and Cash Equivalents         $1,205,552      997,734     1,156,835
                                       Short-Term Investments                -             -             -
                                       Net Receivables                     943,813       760,643      759,033
                                       Inventory                           383,149       376,897      418,633
                                       Other Current Assets                317,624       277,226      302,649
                                       Total Current Assets               2,850,138     2,412,500    2,637,150
                                       Long-Term Investments                 -             -             -
                                       Property, Plant, and Equipment      536,749       547,104      586,526
                                       Goodwill                            845,324       718,069      735,680
                                       Intangible Assets                    70,593        20,422       22,926
                                       Accumulated Amortization              -             -             -
                                       Other Assets                        149,912       178,304      201,836
                                       Deferred Long-Term Asset Charges    503,168       495,914      572,374
                                       Total Assets                      $4,955,884     4,372,313    4,756,492

                                       Liabilities
                                       Current Liabilities
                                       Accounts Payable                  $1,518,234     1,245,191    1,303,822
                                       Short/Current Long-Term Debt         64,286       217,994      423,349
                                       Other Current Liabilities             -             -             -
                                       Total Current Liabilities          1,582,520     1,463,185    1,727,171
                                       Long-Term Debt                      635,714       525,000      400,000
                                       Other Liabilities                   304,676       282,395      243,509
                                       Deferred Long-Term Liability Charges  -             -             -
                                       Minority Interest                     -             -             -
                                       Negative Goodwill                     -             -             -
                                       Total Liabilities                  2,522,910     2,270,580    2,370,680
                                       Stockholders’ Equity
                                       Misc. Stocks, Options, Warrants       -             -             -
                                       Redeemable Preferred Stock            -             -             -
                                       Preferred Stock                       -             -             -
                                       Common Stock                        441,369       441,369      441,369
                                       Retained Earnings                  1,652,140     1,314,068    1,093,288
                                       Treasury Stock                     (996,981)     (935,711)    (473,349)
                                       Capital Surplus                    1,613,307     1,589,281    1,594,332
                                       Other Stockholders’ Equity         (276,861)     (307,274)    (269,828)
                                       Total Stockholders’ Equity         2,432,974     2,101,733    2,385,812
                                       Total Liabilities and SE          $4,955,884     4,372,313    4,756,492


                                      Tables 8-11 and 8-12, so that the seven strategy statements above can be more readily seen
                                      on respective rows. Note the author’s comments on Tables 8-11 and 8-12 that help explain
                                      changes in the numbers.
                                         The U.S. Securities and Exchange Commission (SEC) conducts fraud investiga-
                                      tions if projected numbers are misleading or if they omit information that’s important
                                      to investors. Projected statements must conform with generally accepted accounting
                                      principles (GAAP) and must not be designed to hide poor expected results. The
   299   300   301   302   303   304   305   306   307   308   309