
Page 194 - Sustainability in the Process Industry Integration and Optimization
P. 194
Co m b i n e d P r o c e s s I n t e g r a t i o n a n d O p t i m i z a t i o n 171
J K L
7 8 9 10
E F G H
3 4 5 6
C D
1 2
A B
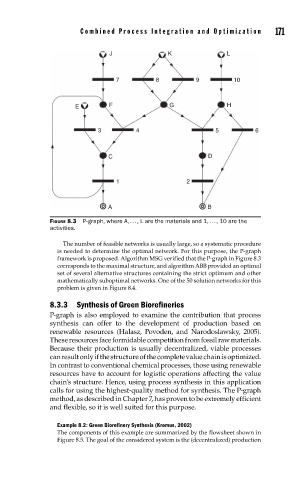
FIGURE 8.3 P-graph, where A, . . . , L are the materials and 1, . . . , 10 are the
activities.
The number of feasible networks is usually large, so a systematic procedure
is needed to determine the optimal network. For this purpose, the P-graph
framework is proposed. Algorithm MSG verified that the P-graph in Figure 8.3
corresponds to the maximal structure, and algorithm ABB provided an optimal
set of several alternative structures containing the strict optimum and other
mathematically suboptimal networks. One of the 50 solution networks for this
problem is given in Figure 8.4.
8.3.3 Synthesis of Green Biorefineries
P-graph is also employed to examine the contribution that process
synthesis can offer to the development of production based on
renewable resources (Halasz, Povoden, and Narodoslawsky, 2005).
These resources face formidable competition from fossil raw materials.
Because their production is usually decentralized, viable processes
can result only if the structure of the complete value chain is optimized.
In contrast to conventional chemical processes, those using renewable
resources have to account for logistic operations affecting the value
chain’s structure. Hence, using process synthesis in this application
calls for using the highest-quality method for synthesis. The P-graph
method, as described in Chapter 7, has proven to be extremely efficient
and flexible, so it is well suited for this purpose.
Example 8.2: Green Biorefi nery Synthesis (Kromus, 2002)
The components of this example are summarized by the flowsheet shown in
Figure 8.5. The goal of the considered system is the (decentralized) production