
Page 198 - Sustainability in the Process Industry Integration and Optimization
P. 198
Co m b i n e d P r o c e s s I n t e g r a t i o n a n d O p t i m i z a t i o n 175
S
MP CTrS
J C SC
CTrC CP
LTrS LTrJ LTrC CTrJ
CL
LF CC
JC
SL JL RFL GBR
CTrRF CF
F 1
RJC
RFC LA AA
LCS LCJ LCC LCRF CCRF F 2 CCC CCJ CCRJ CCS
GODML GODMC
CBG
LBG
E 1 E 2
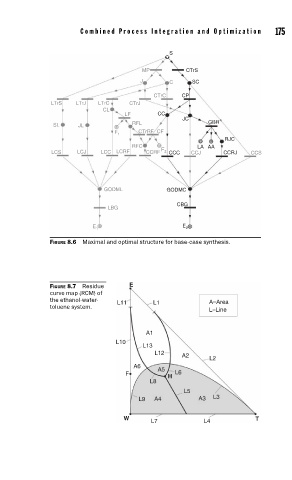
FIGURE 8.6 Maximal and optimal structure for base-case synthesis.
FIGURE 8.7 Residue E
curve map (RCM) of
the ethanol-water- L11 L1 A=Area
toluene system.
L=Line
A1
L10
L13
L12 A2
L2
A6 A5
F L6
H
L8
L5
L9 A4 A3 L3
W T
L7 L4