Page 202 - Sustainability in the Process Industry Integration and Optimization
P. 202

Co m b i n e d  P r o c e s s I n t e g r a t i o n a n d O p t i m i z a t i o n    179


                            S00
                            E1
                      C1          G1
                          S11  S05
                     S52  S51  S16 S03
                      B1  B2  S1  B3  B4                                 D2  D1
                                 S01
                     S53        S54                                   S07 S06 S13
                           S08
                                                            S43  S46 S43
                      D5  D7  D9  D11  S34 D17  D13  D14  D21          A2 D3  A1
                                  D15     S36      D19         D25  D27
                       S15  S17  S32  S33  S35    S37       S44   S48  S49
                             S31                    S38  S39 S40  S45    S02
                                                     D20          D28  D29
                       D6  D8  D10  D12  D16  D18         D22  D26
                                                                             S09
                                                                           S19
                                                                           S20
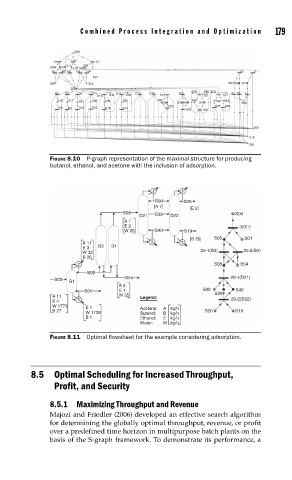
                     FIGURE 8.10  P-graph representation of the maximal structure for producing
                     butanol, ethanol, and acetone with the inclusion of adsorption.


                                                  S09     S20
                                                 [A 7]     [E 2]
                                         S08      S39                   S00
                                              D21     D22
                                         A 7
                                         E 2                             3(G1)
                                         W 26     S40     S19
                                                           [B 26]  S05    S01
                              A 11
                              E 3  B3  B4                     25-1(B3)    25-2(B4)
                              W 35
                              B 26
                                                                  S08    S54
                               S05
                                          S54                         20-1(D21)
                      S00
                          G1
                                        A 4
                              S01       E 1                    S09      S40
                      A 11              W 35  Legend:             S39  20-2(D22)
                      E 4
                      W 1773   E 1            Acetone:  A  kg/h
                      B 27     W 1738         Butanol:  B  kg/h  S20    S19
                               B 1            Ethanol:  E  kg/h
                                              Water:  W  kg/h
                     FIGURE 8.11  Optimal fl owsheet for the example considering adsorption.


                8.5   Optimal Scheduling for Increased Throughput,
                      Profit, and Security

                     8.5.1  Maximizing Throughput and Revenue
                     Majozi and Friedler (2006) developed an effective search algorithm
                     for determining the globally optimal throughput, revenue, or profit
                     over a predefined time horizon in multipurpose batch plants on the
                     basis of the S-graph framework. To demonstrate its performance, a
   197   198   199   200   201   202   203   204   205   206   207