Page 205 - Sustainability in the Process Industry Integration and Optimization
P. 205

182   Cha p te r  E i g h t


                     exchange without compromising the quality of the scheduling
                     solution.


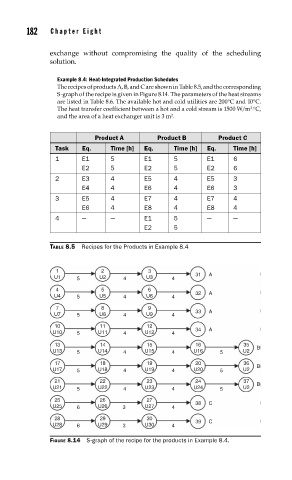
                       Example 8.4: Heat-Integrated Production Schedules
                       The recipes of products A, B, and C are shown in Table 8.5, and the corresponding
                       S-graph of the recipe is given in Figure 8.14. The parameters of the heat streams
                       are listed in Table 8.6. The available hot and cold utilities are 200°C and 10°C.
                       The heat transfer coefficient between a hot and a cold stream is 1500 W/m ∙ °C,
                                                                            2
                       and the area of a heat exchanger unit is 3 m . 2
                                 Product A        Product B        Product C
                       Task   Eq.     Time [h]  Eq.    Time [h]  Eq.   Time [h]
                       1      E1      5        E1      5        E1     6
                              E2      5        E2      5        E2     6
                       2      E3      4        E5      4        E5     3
                              E4      4        E6      4        E6     3
                       3      E5      4        E7      4        E7     4
                              E6      4        E8      4        E8     4
                       4      —       —        E1      5        —      —
                                               E2      5


                     TABLE 8.5  Recipes for the Products in Example 8.4


                       1           2            3
                      U1    5      U2    4     U3     4      31  A
                       4           5            6
                                                             32  A
                      U4    5      U5    4     U6     4
                       7           8            9
                                                             33  A
                      U7    5      U8    4     U9     4
                      10           11          12
                      U10   5     U11    4     U12    4      34  A
                      13           14          15            16           35
                                                                             B
                      U13   5     U14    4     U15    4     U16    5      U2
                      17           18          19            20           36
                                                                             B
                      U17   5     U18    4     U19    4     U20    5      U2
                      21           22          23            24           37
                      U21   5     U22    4     U23    4     U24    5      U2  B
                      25           26          27
                                                             38  C
                      U25   6     U26    3     U27    4
                      28           29          30
                                                             39  C
                      U28   6     U29    3     U30    4
                     FIGURE 8.14  S-graph of the recipe for the products in Example 8.4.
   200   201   202   203   204   205   206   207   208   209   210