
Page 200 - Sustainability in the Process Industry Integration and Optimization
P. 200
Co m b i n e d P r o c e s s I n t e g r a t i o n a n d O p t i m i z a t i o n 177
M 9
M 10 M 8 6
7 5
M 11 M 2 M (1) M (6) M 10 M 11
6
6
M 4 2
M 7 M M 7
M 1 5 7 M
4 M 6 (4) 8
3 4 5
M 9 328 363 343
6 M 6 M 3 1 M (3) M 3 (4) M
3
363 4
353 M 3 (1)
3
M 5 333
1 2
Heating:
M M
Cooling: 1 2
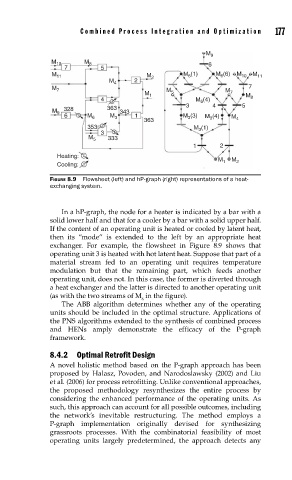
FIGURE 8.9 Flowsheet (left) and hP-graph (right) representations of a heat-
exchanging system.
In a hP-graph, the node for a heater is indicated by a bar with a
solid lower half and that for a cooler by a bar with a solid upper half.
If the content of an operating unit is heated or cooled by latent heat,
then its “mode” is extended to the left by an appropriate heat
exchanger. For example, the flowsheet in Figure 8.9 shows that
operating unit 3 is heated with hot latent heat. Suppose that part of a
material stream fed to an operating unit requires temperature
modulation but that the remaining part, which feeds another
operating unit, does not. In this case, the former is diverted through
a heat exchanger and the latter is directed to another operating unit
(as with the two streams of M in the figure).
6
The ABB algorithm determines whether any of the operating
units should be included in the optimal structure. Applications of
the PNS algorithms extended to the synthesis of combined process
and HENs amply demonstrate the efficacy of the P-graph
framework.
8.4.2 Optimal Retrofit Design
A novel holistic method based on the P-graph approach has been
proposed by Halasz, Povoden, and Narodoslawsky (2002) and Liu
et al. (2006) for process retrofitting. Unlike conventional approaches,
the proposed methodology resynthesizes the entire process by
considering the enhanced performance of the operating units. As
such, this approach can account for all possible outcomes, including
the network’s inevitable restructuring. The method employs a
P-graph implementation originally devised for synthesizing
grassroots processes. With the combinatorial feasibility of most
operating units largely predetermined, the approach detects any