
Page 201 - Sustainability in the Process Industry Integration and Optimization
P. 201
178 Cha p te r E i g h t
necessary retrofit changes in the network structure. For example, the
retrofit of a conventional downstream process for the biochemical
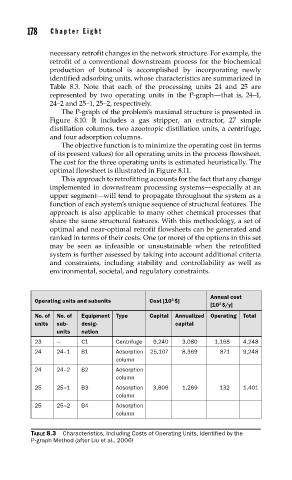
production of butanol is accomplished by incorporating newly
identified adsorbing units, whose characteristics are summarized in
Table 8.3. Note that each of the processing units 24 and 25 are
represented by two operating units in the P-graph—that is, 24–1,
24–2 and 25–1, 25–2, respectively.
The P-graph of the problem’s maximal structure is presented in
Figure 8.10. It includes a gas stripper, an extractor, 27 simple
distillation columns, two azeotropic distillation units, a centrifuge,
and four adsorption columns.
The objective function is to minimize the operating cost (in terms
of its present values) for all operating units in the process flowsheet.
The cost for the three operating units is estimated heuristically. The
optimal flowsheet is illustrated in Figure 8.11.
This approach to retrofitting accounts for the fact that any change
implemented in downstream processing systems—especially at an
upper segment—will tend to propagate throughout the system as a
function of each system’s unique sequence of structural features. The
approach is also applicable to many other chemical processes that
share the same structural features. With this methodology, a set of
optimal and near-optimal retrofit flowsheets can be generated and
ranked in terms of their costs. One (or more) of the options in this set
may be seen as infeasible or unsustainable when the retrofitted
system is further assessed by taking into account additional criteria
and constraints, including stability and controllability as well as
environmental, societal, and regulatory constraints.
Annual cost
3
Operating units and subunits Cost [10 $]
3
[10 $/y]
No. of No. of Equipment Type Capital Annualized Operating Total
units sub- desig- capital
units nation
23 — C1 Centrifuge 9,240 3,080 1,168 4,248
24 24–1 B1 Adsorption 25,107 8,369 871 9,248
column
24 24–2 B2 Adsorption
column
25 25–1 B3 Adsorption 3,806 1,269 132 1,401
column
25 25–2 B4 Adsorption
column
TABLE 8.3 Characteristics, Including Costs of Operating Units, Identified by the
P-graph Method (after Liu et al., 2006)