
Page 206 - Sustainability in the Process Industry Integration and Optimization
P. 206
Co m b i n e d P r o c e s s I n t e g r a t i o n a n d O p t i m i z a t i o n 183
Name Type Initial temp. Final temp. Heat Product/
[°C] [°C] [MJ] Task
c Cold 40 120 400 A/2
1
h Hot 140 50 200 B/3
1
c Cold 80 130 100 B/4
2
h Hot 150 40 300 C/2
2
TABLE 8.6 Parameter Values for the Heating and Cooling Requirements in
Example 8.4
E1 1 4 13 21 10 20
E2 25 2 28 5 17 7 8 16 24
Equipment Units E4 3 14 6 11 9
E3
E5
E6
E7 26 29 18 22 19 12
E8 27 30 15 23
10 20 30 36
Time [h]
Product A Product B Product C
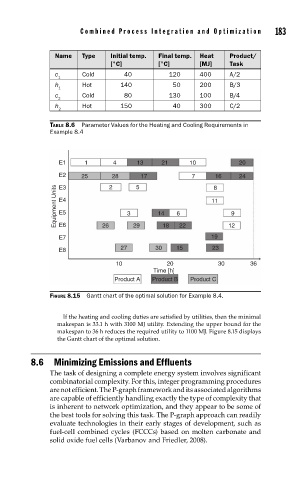
FIGURE 8.15 Gantt chart of the optimal solution for Example 8.4.
If the heating and cooling duties are satisfied by utilities, then the minimal
makespan is 33.1 h with 3100 MJ utility. Extending the upper bound for the
makespan to 36 h reduces the required utility to 1100 MJ. Figure 8.15 displays
the Gantt chart of the optimal solution.
8.6 Minimizing Emissions and Effluents
The task of designing a complete energy system involves significant
combinatorial complexity. For this, integer programming procedures
are not efficient. The P-graph framework and its associated algorithms
are capable of efficiently handling exactly the type of complexity that
is inherent to network optimization, and they appear to be some of
the best tools for solving this task. The P-graph approach can readily
evaluate technologies in their early stages of development, such as
fuel-cell combined cycles (FCCCs) based on molten carbonate and
solid oxide fuel cells (Varbanov and Friedler, 2008).