
Page 209 - Sustainability in the Process Industry Integration and Optimization
P. 209
186 Cha p te r E i g h t
and economic data specifications, which provide the basis for appropriate
economic evaluation of the designs, are given in Varbanov and Friedler (2008).
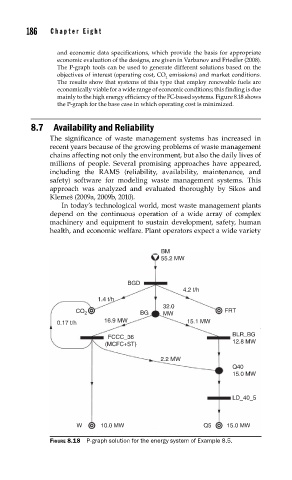
The P-graph tools can be used to generate different solutions based on the
objectives of interest (operating cost, CO emissions) and market conditions.
2
The results show that systems of this type that employ renewable fuels are
economically viable for a wide range of economic conditions; this finding is due
mainly to the high energy efficiency of the FC-based systems. Figure 8.18 shows
the P-graph for the base case in which operating cost is minimized.
8.7 Availability and Reliability
The significance of waste management systems has increased in
recent years because of the growing problems of waste management
chains affecting not only the environment, but also the daily lives of
millions of people. Several promising approaches have appeared,
including the RAMS (reliability, availability, maintenance, and
safety) software for modeling waste management systems. This
approach was analyzed and evaluated thoroughly by Sikos and
Klemeš (2009a, 2009b, 2010).
In today’s technological world, most waste management plants
depend on the continuous operation of a wide array of complex
machinery and equipment to sustain development, safety, human
health, and economic welfare. Plant operators expect a wide variety
BM
55.2 MW
BGD
4.2 t/h
1.4 t/h
32.0
CO 2 BG MW FRT
0.17 t/h 16.9 MW 15.1 MW
FCCC_36 BLR_BG
(MCFC+ST) 12.8 MW
2.2 MW
Q40
15.0 MW
LD_40_5
W 10.0 MW Q5 15.0 MW
FIGURE 8.18 P-graph solution for the energy system of Example 8.5.