
Page 208 - Sustainability in the Process Industry Integration and Optimization
P. 208
Co m b i n e d P r o c e s s I n t e g r a t i o n a n d O p t i m i z a t i o n 185
number of options. This optimization task may have several different objectives.
The most obvious are maximizing the system profit (minimizing its cost) and
minimizing the amount of CO emissions. Although it is mathematically
2
possible to define a multiobjective criterion to be optimized, using profitability
alone seems most coherent with the logic of a market economy because profit
drives the behavior of companies. Therefore, in this discussion the system profit
is used as the objective (to be maximized); CO emissions are then used as an
2
additional criterion during the analysis stage.
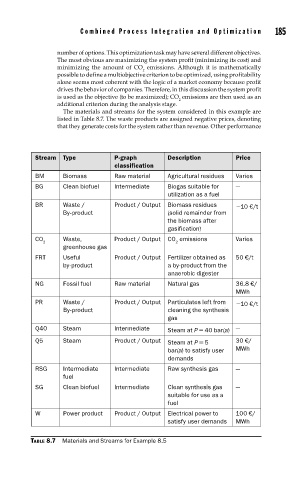
The materials and streams for the system considered in this example are
listed in Table 8.7. The waste products are assigned negative prices, denoting
that they generate costs for the system rather than revenue. Other performance
Stream Type P-graph Description Price
classification
BM Biomass Raw material Agricultural residues Varies
BG Clean biofuel Intermediate Biogas suitable for —
utilization as a fuel
BR Waste / Product / Output Biomass residues −10 €/t
By-product (solid remainder from
the biomass after
gasification)
CO Waste, Product / Output CO emissions Varies
2 2
greenhouse gas
FRT Useful Product / Output Fertilizer obtained as 50 €/t
by-product a by-product from the
anaerobic digester
NG Fossil fuel Raw material Natural gas 36.8 €/
MWh
PR Waste / Product / Output Particulates left from −10 €/t
By-product cleaning the synthesis
gas
Q40 Steam Intermediate Steam at P = 40 bar(a) —
Q5 Steam Product / Output Steam at P = 5 30 €/
bar(a) to satisfy user MWh
demands
RSG Intermediate Intermediate Raw synthesis gas —
fuel
SG Clean biofuel Intermediate Clean synthesis gas —
suitable for use as a
fuel
W Power product Product / Output Electrical power to 100 €/
satisfy user demands MWh
TABLE 8.7 Materials and Streams for Example 8.5