
Page 207 - Sustainability in the Process Industry Integration and Optimization
P. 207
184 Cha p te r E i g h t
Example 8.5: FCCC Systems for Reducing Carbon Footprint
This example presents a procedure for evaluating energy conversion systems
involving FCCC subsystems that use biomass and/or fossil fuels; see Figure 8.16.
The procedure provides a tool for evaluating trends in CO emission levels
2
and the economics of such systems. The significant combinatorial complexity
involved is efficiently handled by P-graph algorithms. Promising system
components are evaluated by a methodology for synthesizing cost-optimal
FCCC configurations that account for the carbon footprint of the various
technology and fuel options using the P-graph framework.
The efficiency of an FCCC system varies with the fuel-cell (FC) operating
temperature, the type of bottoming cycle, and the degree of cycle integration
(see Varbanov et al., 2007). High-temperature fuel cells can be combined with
gas turbines, steam turbines, or both; however, combining all three yields only
marginal improvements. The main reason is that energy in the FC exhaust can
only be shared by the bottoming cycles, and typically this potential for energy
generation is most fully utilized by a steam or gas turbine alone. Hence the
involvement of more than one bottoming cycle cannot substantially increase
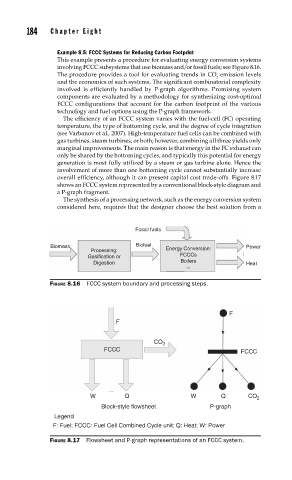
overall efficiency, although it can present capital cost trade-offs. Figure 8.17
shows an FCCC system represented by a conventional block-style diagram and
a P-graph fragment.
The synthesis of a processing network, such as the energy conversion system
considered here, requires that the designer choose the best solution from a
Fossil fuels
Biomass Biofuel Energy Conversion: Power
Processing:
Gasification or FCCCs
Boilers
Digestion Heat
...
FIGURE 8.16 FCCC system boundary and processing steps.
F
F
CO 2
FCCC FCCC
W Q W Q CO 2
Block-style flowsheet P-graph
Legend
F: Fuel; FCCC: Fuel Cell Combined Cycle unit; Q: Heat; W: Power
FIGURE 8.17 Flowsheet and P-graph representations of an FCCC system.