
Page 199 - Sustainability in the Process Industry Integration and Optimization
P. 199
176 Cha p te r E i g h t
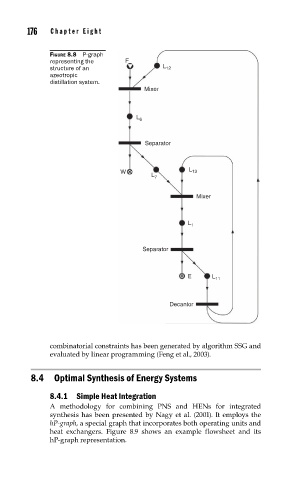
FIGURE 8.8 P-graph
representing the F
structure of an L 12
azeotropic
distillation system.
Mixer
L 6
Separator
L
W 13
L 7
Mixer
L 1
Separator
E L 11
Decantor
combinatorial constraints has been generated by algorithm SSG and
evaluated by linear programming (Feng et al., 2003).
8.4 Optimal Synthesis of Energy Systems
8.4.1 Simple Heat Integration
A methodology for combining PNS and HENs for integrated
synthesis has been presented by Nagy et al. (2001). It employs the
hP-graph, a special graph that incorporates both operating units and
heat exchangers. Figure 8.9 shows an example flowsheet and its
hP-graph representation.