
Page 302 - Sustainability in the Process Industry Integration and Optimization
P. 302
I n d u s t r i a l A p p l i c a t i o n s a n d Ca s e S t u d i e s 279
nd
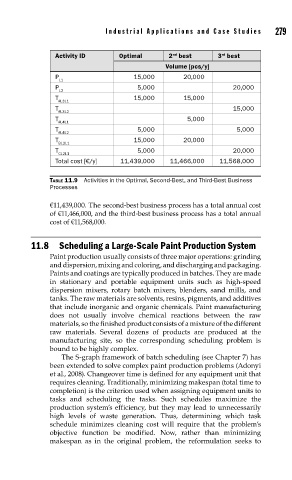
Activity ID Optimal 2 best 3 best
rd
Volume [pcs/y]
P 15,000 20,000
L1
P 5,000 20,000
L2
T 15,000 15,000
AL3L1
T 15,000
AL3L2
T 5,000
AL4L1
T 5,000 5,000
AL4L2
T 15,000 20,000
BL2L1
T 5,000 20,000
CL2L1
Total cost [€/y] 11,439,000 11,466,000 11,568,000
TABLE 11.9 Activities in the Optimal, Second-Best, and Third-Best Business
Processes
€11,439,000. The second-best business process has a total annual cost
of €11,466,000, and the third-best business process has a total annual
cost of €11,568,000.
11.8 Scheduling a Large-Scale Paint Production System
Paint production usually consists of three major operations: grinding
and dispersion, mixing and coloring, and discharging and packaging.
Paints and coatings are typically produced in batches. They are made
in stationary and portable equipment units such as high-speed
dispersion mixers, rotary batch mixers, blenders, sand mills, and
tanks. The raw materials are solvents, resins, pigments, and additives
that include inorganic and organic chemicals. Paint manufacturing
does not usually involve chemical reactions between the raw
materials, so the finished product consists of a mixture of the different
raw materials. Several dozens of products are produced at the
manufacturing site, so the corresponding scheduling problem is
bound to be highly complex.
The S-graph framework of batch scheduling (see Chapter 7) has
been extended to solve complex paint production problems (Adonyi
et al., 2008). Changeover time is defined for any equipment unit that
requires cleaning. Traditionally, minimizing makespan (total time to
completion) is the criterion used when assigning equipment units to
tasks and scheduling the tasks. Such schedules maximize the
production system’s efficiency, but they may lead to unnecessarily
high levels of waste generation. Thus, determining which task
schedule minimizes cleaning cost will require that the problem’s
objective function be modified. Now, rather than minimizing
makespan as in the original problem, the reformulation seeks to