
Page 297 - Sustainability in the Process Industry Integration and Optimization
P. 297
274 C h apter Ele v e n
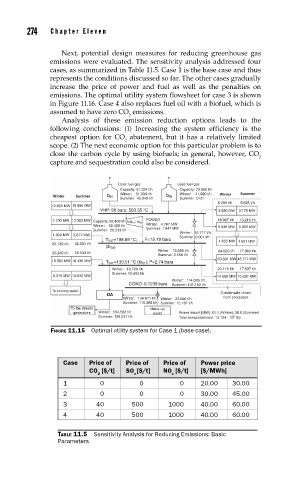
Next, potential design measures for reducing greenhouse gas
emissions were evaluated. The sensitivity analysis addressed four
cases, as summarized in Table 11.5. Case 1 is the base case and thus
represents the conditions discussed so far. The other cases gradually
increase the price of power and fuel as well as the penalties on
emissions. The optimal utility system flowsheet for case 3 is shown
in Figure 11.16. Case 4 also replaces fuel oil with a biofuel, which is
assumed to have zero CO emissions.
2
Analysis of these emission reduction options leads to the
following conclusions: (1) Increasing the system efficiency is the
cheapest option for CO abatement, but it has a relatively limited
2
scope. (2) The next economic option for this particular problem is to
close the carbon cycle by using biofuels; in general, however, CO
2
capture and sequestration could also be considered.
Uses fuel gas Uses fuel gas
Capacity: 51.334 t/h Capacity: 70.000 t/h
Winter: 51.334 t/h Winter: 41.990 t/h Winter Summer
Winter Summer b 01 b 02
Summer: 45.049 t/h Summer: 0 t/h
6.289 t/h 5.625 t/h
12.000 MW 16.885 MW
VHP: 90 bara, 503.35 °C 3.550 MW 3.175 MW
POWER 18.907 t/h 13.210 t/h
7.700 MW 13.383 MW Capacity: 52.409 t/h hdr 01 : st 01
Winter: 52.409 t/h Winter: 4.767 MW 9.038 MW 5.956 MW
Summer: 26.213 t/h Summer: 1.941 MW Winter: 15.717 t/h
1.300 MW 2.877 MW Summer: 0.001 t/h
T SAT =198.89 °C; P=15.19 bara 1.635 MW 1.501 MW
33.139 t/h 52.304 t/h
(tb 03)
Winter: 16.645 t/h 84.620 t/h 77.960 t/h
25.240 t/h 29.533 t/h
Summer: 0.558 t/h
50.591 MW 43.777 MW
15.500 MW 18.136 MW T SAT =130.51 °C (tb 01 ); P=2.74 bara
Winter: 18.769 t/h 23.116 t/h 17.597 t/h
Summer: 12.493 t/h
8.210 MW 10.632 MW 14.660 MW 10.632 MW
Winter: 114.025 t/h
COND: 0.1235 bara Summer: 101.182 t/h
To cooling water Condensate return
DA
Winter: 136.671 t/h Winter: 22.646 t/h from processes
Summer: 116.369 t/h Summer: 15.187 t/h
To the stream Make-up
generators Winter: 154.502 t/h water Power import [MW]: 21.1 (Winter); 30.0 (Summer)
Summer: 128.237 t/h Total annualized cost: 13.124 · 10 $/y
6
FIGURE 11.15 Optimal utility system for Case 1 (base case).
Case Price of Price of Price of Power price
CO [$/t] SO [$/t] NO [$/t] [$/MWh]
2 x x
1 0 0 0 20.00 30.00
2 0 0 0 30.00 45.00
3 40 500 1000 40.00 60.00
4 40 500 1000 40.00 60.00
TABLE 11.5 Sensitivity Analysis for Reducing Emissions: Basic
Parameters