
Page 298 - Sustainability in the Process Industry Integration and Optimization
P. 298
I n d u s t r i a l A p p l i c a t i o n s a n d Ca s e S t u d i e s 275
Power
gt 01
Capacity: 33.917 MW Capacity: 28.570 t/h
Winter: 30.085 MW Winter: 0.000 t/h
Winter: 95.230 t/h
Summer: 33.916 MW Summer: 0.000 t/h
Winter Summer Summer: 45.022 t/h Winter Summer
b 02
HRSG
6.289 t/h 5.625 t/h
12.000 MW 16.885 MW
VHP: 90 bara, 503.35°C 3.550 MW 3.175 MW
7.700 MW 13.383 MW Power 18.907 t/h 13.210 t/h
Capacity: 52.017 t/h hdr 01 : st 01
Winter: 52.017 t/h Winter: 7.722 MW 9.038 MW 5.956 MW
Summer: 26.023 t/h Summer: 1.942 MW
Winter: 18.016 t/h
1.300 MW 2.877 MW
Summer: 0.164 t/h
T SAT = 198.89°C; P=15.19 bara (tb 03 )
1.635 MW 1.501 MW
33.139 t/h 52.304 t/h
Power
Capacity: 20.000 t/h hdr 02 : st 01 Winter: 0.733 MW 84.271 t/h 77.935 t/h
25.240 t/h 29.533 t/h
Winter: 13.997 t/h
Summer: 0.000 MW
Summer: 0.000 t/h 50.591 MW 43.777 MW
15.500 MW 18.136 MW Winter: 4.904 t/h
Summer: 0.555 t/h
T SAT = 130.51°C; P=2.74 bara (tb 01 ) 24.272 t/h 17.597 t/h
8.210 MW 10.632 MW 14.660 MW 10.632 MW
Winter: 19.869 t/h
Summer: 12.491 t/h
COND: 0.1235 bara
To cooling water
Winter: 114.832 t/h Condensate return
DA from processes
Winter: 137.590 t/h Winter: 22.758 t/h Summer: 101.157 t/h
Summer: 116.343 t/h Summer: 15.119 t/h
To the stream Make-up
generators Winter: 156.466 t/h water Power export [MW]: 10.0 (Winter); 4.4 (Summer)
Summer: 128.209 t/h Total annualized cost: 23.060 · 10 6 $/y
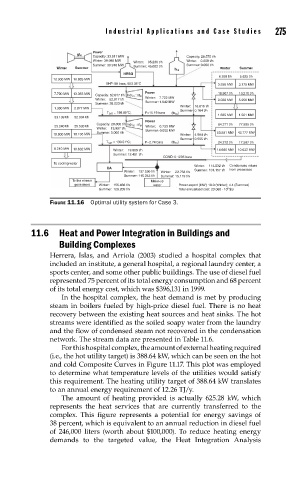
FIGURE 11.16 Optimal utility system for Case 3.
11.6 Heat and Power Integration in Buildings and
Building Complexes
Herrera, Islas, and Arriola (2003) studied a hospital complex that
included an institute, a general hospital, a regional laundry center, a
sports center, and some other public buildings. The use of diesel fuel
represented 75 percent of its total energy consumption and 68 percent
of its total energy cost, which was $396,131 in 1999.
In the hospital complex, the heat demand is met by producing
steam in boilers fueled by high-price diesel fuel. There is no heat
recovery between the existing heat sources and heat sinks. The hot
streams were identified as the soiled soapy water from the laundry
and the flow of condensed steam not recovered in the condensation
network. The stream data are presented in Table 11.6.
For this hospital complex, the amount of external heating required
(i.e., the hot utility target) is 388.64 kW, which can be seen on the hot
and cold Composite Curves in Figure 11.17. This plot was employed
to determine what temperature levels of the utilities would satisfy
this requirement. The heating utility target of 388.64 kW translates
to an annual energy requirement of 12.26 TJ/y.
The amount of heating provided is actually 625.28 kW, which
represents the heat services that are currently transferred to the
complex. This figure represents a potential for energy savings of
38 percent, which is equivalent to an annual reduction in diesel fuel
of 246,000 liters (worth about $100,000). To reduce heating energy
demands to the targeted value, the Heat Integration Analysis