
Page 293 - Sustainability in the Process Industry Integration and Optimization
P. 293
270 C h apter Ele v e n
500
Shifted temperature [°C] 400 Gas turbine exhaust
300
200 Waste
Site steam heat
Driver steam boiler
Gas turbine Boiler Feed Water heating
exhaust
Heat
pump Cooling
water
−10 0 10 20 30 40 50 60
Net heat flow [MW]
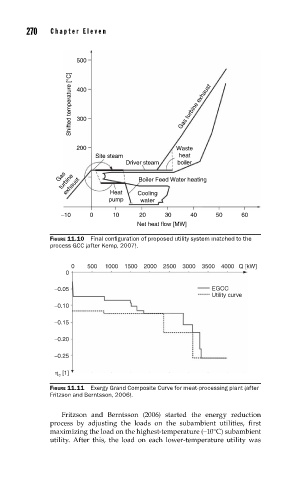
FIGURE 11.10 Final confi guration of proposed utility system matched to the
process GCC (after Kemp, 2007).
0 500 1000 1500 2000 2500 3000 3500 4000 Q [kW]
0
−0.05 EGCC
Utility curve
−0.10
−0.15
−0.20
−0.25
[1]
η c
FIGURE 11.11 Exergy Grand Composite Curve for meat-processing plant (after
Fritzson and Berntsson, 2006).
Fritzson and Berntsson (2006) started the energy reduction
process by adjusting the loads on the subambient utilities, first
maximizing the load on the highest-temperature (−10°C) subambient
utility. After this, the load on each lower-temperature utility was