
Page 289 - Sustainability in the Process Industry Integration and Optimization
P. 289
266 C h apter Ele v e n
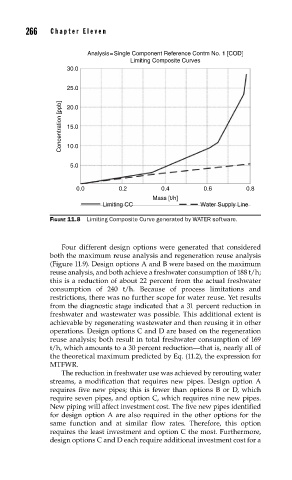
Analysis=Single Component Reference Contm No. 1 [COD]
Limiting Composite Curves
30.0
25.0
Concentration [ppb] 20.0
15.0
10.0
5.0
0.0 0.2 0.4 0.6 0.8
Mass [t/h]
Limiting CC Water Supply Line
FIGURE 11.8 Limiting Composite Curve generated by WATER software.
Four different design options were generated that considered
both the maximum reuse analysis and regeneration reuse analysis
(Figure 11.9). Design options A and B were based on the maximum
reuse analysis, and both achieve a freshwater consumption of 188 t/h;
this is a reduction of about 22 percent from the actual freshwater
consumption of 240 t/h. Because of process limitations and
restrictions, there was no further scope for water reuse. Yet results
from the diagnostic stage indicated that a 31 percent reduction in
freshwater and wastewater was possible. This additional extent is
achievable by regenerating wastewater and then reusing it in other
operations. Design options C and D are based on the regeneration
reuse analysis; both result in total freshwater consumption of 169
t/h, which amounts to a 30 percent reduction—that is, nearly all of
the theoretical maximum predicted by Eq. (11.2), the expression for
MTFWR.
The reduction in freshwater use was achieved by rerouting water
streams, a modification that requires new pipes. Design option A
requires five new pipes; this is fewer than options B or D, which
require seven pipes, and option C, which requires nine new pipes.
New piping will affect investment cost. The five new pipes identified
for design option A are also required in the other options for the
same function and at similar flow rates. Therefore, this option
requires the least investment and option C the most. Furthermore,
design options C and D each require additional investment cost for a