
Page 290 - Sustainability in the Process Industry Integration and Optimization
P. 290
I n d u s t r i a l A p p l i c a t i o n s a n d Ca s e S t u d i e s 267
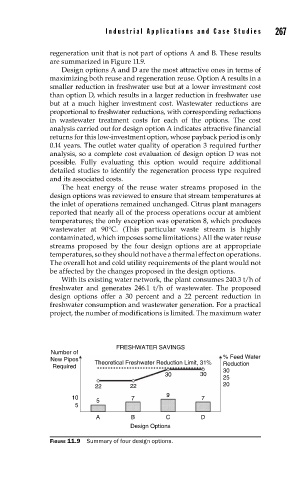
regeneration unit that is not part of options A and B. These results
are summarized in Figure 11.9.
Design options A and D are the most attractive ones in terms of
maximizing both reuse and regeneration reuse. Option A results in a
smaller reduction in freshwater use but at a lower investment cost
than option D, which results in a larger reduction in freshwater use
but at a much higher investment cost. Wastewater reductions are
proportional to freshwater reductions, with corresponding reductions
in wastewater treatment costs for each of the options. The cost
analysis carried out for design option A indicates attractive financial
returns for this low-investment option, whose payback period is only
0.14 years. The outlet water quality of operation 3 required further
analysis, so a complete cost evaluation of design option D was not
possible. Fully evaluating this option would require additional
detailed studies to identify the regeneration process type required
and its associated costs.
The heat energy of the reuse water streams proposed in the
design options was reviewed to ensure that stream temperatures at
the inlet of operations remained unchanged. Citrus plant managers
reported that nearly all of the process operations occur at ambient
temperatures; the only exception was operation 8, which produces
wastewater at 90°C. (This particular waste stream is highly
contaminated, which imposes some limitations.) All the water reuse
streams proposed by the four design options are at appropriate
temperatures, so they should not have a thermal effect on operations.
The overall hot and cold utility requirements of the plant would not
be affected by the changes proposed in the design options.
With its existing water network, the plant consumes 240.3 t/h of
freshwater and generates 246.1 t/h of wastewater. The proposed
design options offer a 30 percent and a 22 percent reduction in
freshwater consumption and wastewater generation. For a practical
project, the number of modifications is limited. The maximum water
FRESHWATER SAVINGS
Number of
New Pipes Theoretical Freshwater Reduction Limit, 31% % Feed Water
Required Reduction
30
30 30
25
22 22 20
9
10 7 7
5
5
A B C D
Design Options
FIGURE 11.9 Summary of four design options.