
Page 288 - Sustainability in the Process Industry Integration and Optimization
P. 288
I n d u s t r i a l A p p l i c a t i o n s a n d Ca s e S t u d i e s 265
0.5 t/h 0.5 t/h
Operation 1
8.96 t/h
Loss to Process, 6.265 t/h
Recycle, 23.7 t/h
6.265 t/h 2.45 t/h 2.45 t/h
Operation 2 Operation 3
Loss to Process, 4.8 t/h Recycle, 0.83 t/h
4.8 t/h 0.79 t/h 0.79 t/h
Operation 7 Operation 6
Gain from Process,
0.48 t/h 4.01 t/h
Operation 11
3.53 t/h
Loss to Process,
10.95 t/h
47.56 t/h 31.83 t/h 39.60 t/h 28.60 t/h
Operation 4 Operation 9
Freshwater Gain from Process, Wastewater
169.3 t/h 28.09 t/h 4.38 t/h 175.05 t/h
90.00 t/h 113.72 t/h
Operation 4a
3.39 t/h 3.39 t/h
Operation 5
Net gain from Process,
28.09 t/h
1.00 t/h 8.82 t/h
Operation 2a/8
Loss to Process
8.64 t/h
15.84 t/h 7.20 t/h
Operation 10
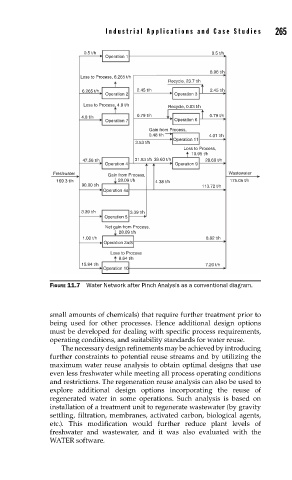
FIGURE 11.7 Water Network after Pinch Analysis as a conventional diagram.
small amounts of chemicals) that require further treatment prior to
being used for other processes. Hence additional design options
must be developed for dealing with specific process requirements,
operating conditions, and suitability standards for water reuse.
The necessary design refinements may be achieved by introducing
further constraints to potential reuse streams and by utilizing the
maximum water reuse analysis to obtain optimal designs that use
even less freshwater while meeting all process operating conditions
and restrictions. The regeneration reuse analysis can also be used to
explore additional design options incorporating the reuse of
regenerated water in some operations. Such analysis is based on
installation of a treatment unit to regenerate wastewater (by gravity
settling, filtration, membranes, activated carbon, biological agents,
etc.). This modification would further reduce plant levels of
freshwater and wastewater, and it was also evaluated with the
WATER software.