
Page 283 - Sustainability in the Process Industry Integration and Optimization
P. 283
260 C h apter Ele v e n
H4, which results in a relatively slower decrease in its temperature.
This fact and the heat exchanger cascade already planned suggest
another topology modification: resequence matches 2 and 3 on
stream C1. Such resequencing would yield a larger driving force in
both matches, although some load would then be shifted to the lower
temperature segment of stream C1.
The network was modified according to the strategy and changes
suggested by the analysis. The result is shown in Figure 11.5. Cooler
C3, on the hot stream with the lowest target temperature, is left at its
old location. This, together with the introduced three loops, will
account for variations in composition of the feedstock. When there is
a larger total heat supply from streams H2 to H5, any heat surplus is
removed from the system through cooler C3.
Comparing the initial and new topologies reveals that a
significant improvement in energy efficiency has been achieved.
The heat recovery fraction is increased from 67.03 to 91.22 percent
for feed 1, from 73.37 to 89.77 percent for feed 2, and from 74.12 to
77.86 percent for feed 3. Although the relative increase for feed 3 is
lower, its net increase in heat recovery is the same as that of
feed 2.
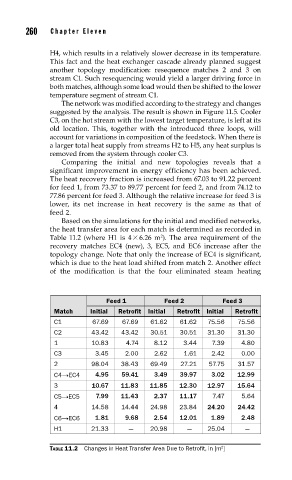
Based on the simulations for the initial and modified networks,
the heat transfer area for each match is determined as recorded in
Table 11.2 (where H1 is 4 × 6.26 m ). The area requirement of the
2
recovery matches EC4 (new), 3, EC5, and EC6 increase after the
topology change. Note that only the increase of EC4 is significant,
which is due to the heat load shifted from match 2. Another effect
of the modification is that the four eliminated steam heating
Feed 1 Feed 2 Feed 3
Match Initial Retrofit Initial Retrofit Initial Retrofit
C1 67.69 67.69 61.62 61.62 75.56 75.56
C2 43.42 43.42 30.51 30.51 31.30 31.30
1 10.83 4.74 8.12 3.44 7.39 4.80
C3 3.45 2.00 2.62 1.61 2.42 0.00
2 98.04 38.43 69.49 27.21 57.75 31.57
C4→EC4 4.95 59.41 3.49 39.97 3.02 12.99
3 10.67 11.83 11.85 12.30 12.97 15.64
C5→EC5 7.99 11.43 2.37 11.17 7.47 5.64
4 14.58 14.44 24.98 23.84 24.20 24.42
C6→EC6 1.81 9.68 2.54 12.01 1.89 2.48
H1 21.33 — 20.98 — 25.04 —
2
TABLE 11.2 Changes in Heat Transfer Area Due to Retrofi t, in [m ]